
- EUR/JPY breaks below 141.00 and hits new three-month lows.
- Further lows would target the key 200 SMA just above 139.00.
EUR/JPY remains entrenched in negative territory and falls to fresh 3-month lows in the 140.80/75 band by the end of the week.
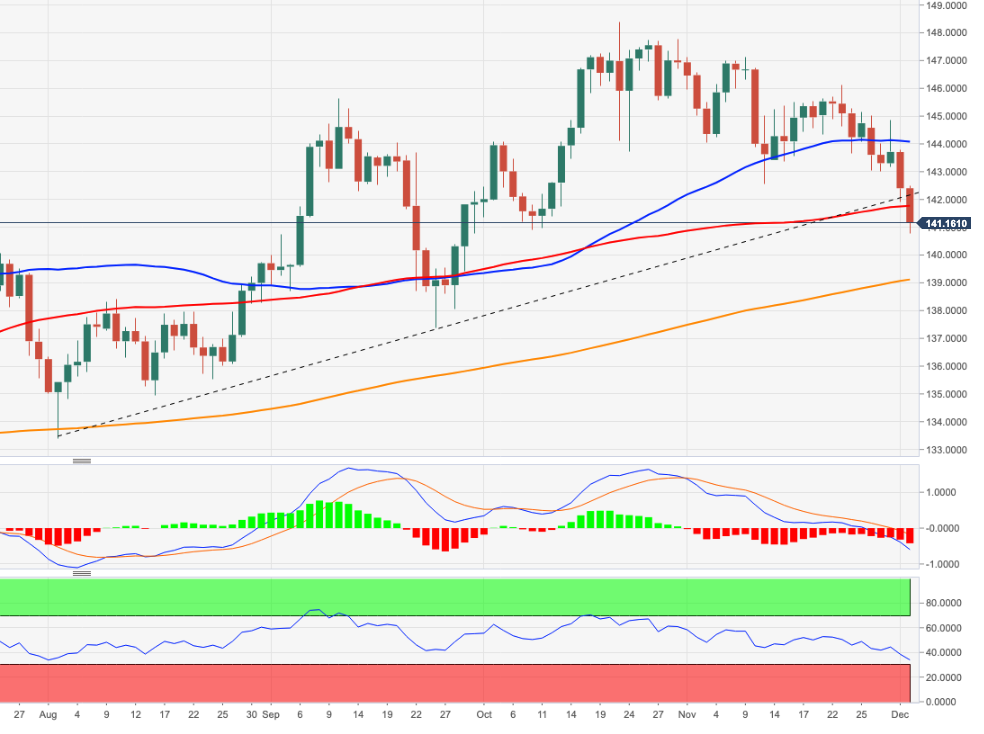
The sharp pullback broke the four-month support line and left the cross vulnerable to a deeper decline. Against this, the next major support is expected at the critical 200-day SMA, today at 139.08.
The outlook for the EUR/JPY is expected to remain positive as long as it is above this region.
EUR/JPY day chart
Source: Fx Street
I am Joshua Winder, a senior-level journalist and editor at World Stock Market. I specialize in covering news related to the stock market and economic trends. With more than 8 years of experience in this field, I have become an expert in financial reporting.


