
- EUR/JPY fell sharply to two-week lows near 139.00.
- A revisit to 2022 highs beyond 145.00 is not ruled out.
EUR/JPY adds to the weekly pullback and falls to multi-session lows near 139.00 following Bank of Japan and government intervention.
The cross found initial support around 139.00, where the 55 and 100 day simple moving averages coincide. However, the decline was not continued and caused a quick rebound to the 140.00 zone and beyond.
However, a further recovery should not be ruled out, and the cross continues to point to the yearly high of 145.63 (September 12) on a relatively short-term horizon.
In the meantime, if it remains above the 200 SMA at 135.51, the outlook for the cross should remain constructive.
EUR/JPY day chart
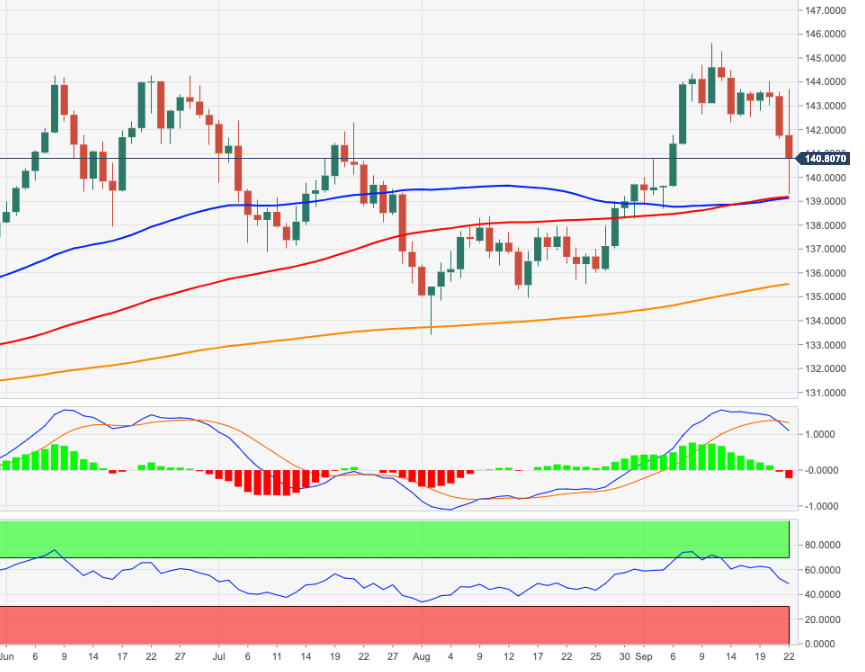
Source: Fx Street
With 6 years of experience, I bring to the table captivating and informative writing in the world news category. My expertise covers a range of industries, including tourism, technology, forex and stocks. From brief social media posts to in-depth articles, I am dedicated to creating compelling content for various platforms.


