
- Although daily chart indicators reveal weakening momentum, the overall trend remains positive.
- On the hourly chart, the RSI is in the negative zone, which implies that sellers are in control during the day.
- To maintain the momentum, bulls need to defend the 20-day SMA.
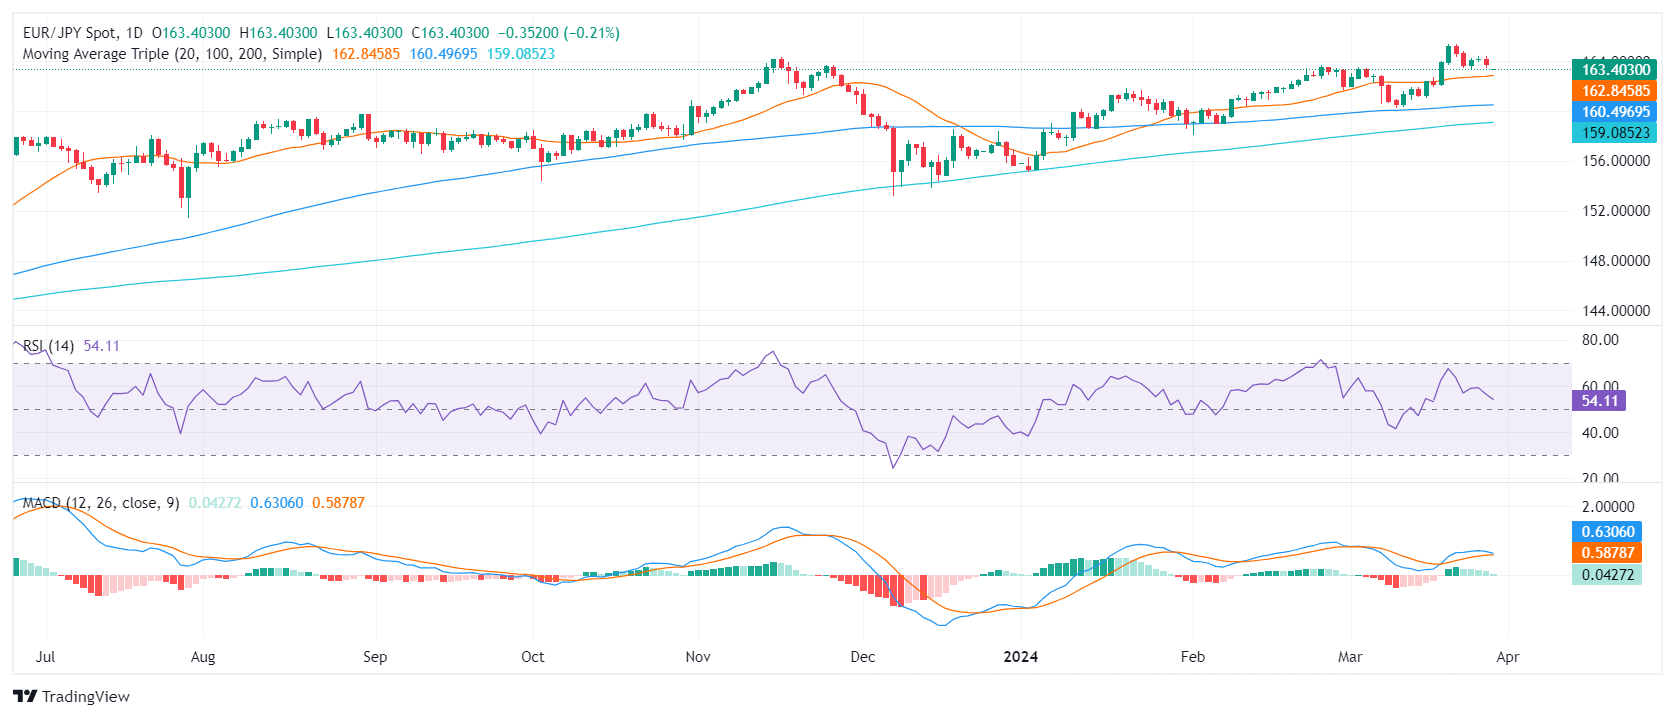
In the Thursday session, the EUR/JPY pair is trading around 163.40, experiencing a slight loss. The broader outlook leans in favor of the bulls, indicating buying strength that keeps the pair above its 20-day, 100-day, and 200-day SMA. Despite this, growing selling pressure is observed on the daily chart.
On the daily chart, the Relative Strength Index (RSI) declined from overbought conditions near 54 last week. The MACD histogram also indicates that the buying momentum could be waning, as deduced from the flat green bars. These market indicators suggest possible short-term volatility in the direction of the pair.
EUR/JPY daily chart
On the hourly chart, the RSI shows more negative sentiment. The last value is located at 44, indicating sellers as dominant in the short-term movements. However, the MACD histogram shows green bars, which adds neutrality to the intraday picture.
EUR/JPY hourly chart
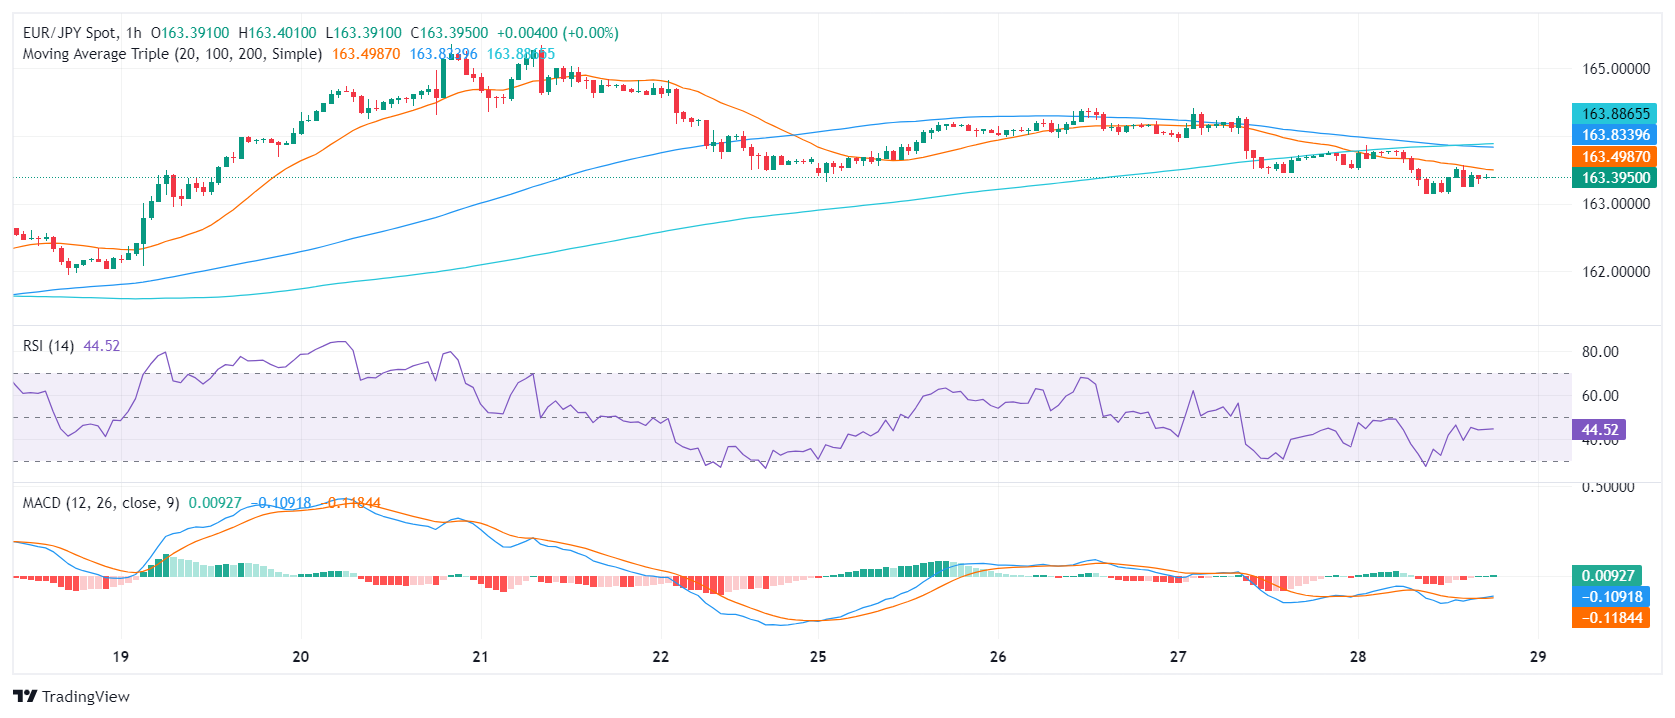
In conclusion, despite the negative sentiment on the hourly chart, the daily and broader indicators suggest that the bulls remain in control of the overall picture. The main task of buyers is to defend the 20-day SMA around 163.00 and as long as the pair remains above this level, the outlook will be positive.
Source: Fx Street
I am Joshua Winder, a senior-level journalist and editor at World Stock Market. I specialize in covering news related to the stock market and economic trends. With more than 8 years of experience in this field, I have become an expert in financial reporting.


