
- EUR/JPY continues its erratic behavior above 141.00.
- The 200-day MA continues to limit the downside near 140.80.
EUR/JPY fades Thursday’s rally and trades on the back foot, still in consolidation, at week’s close.
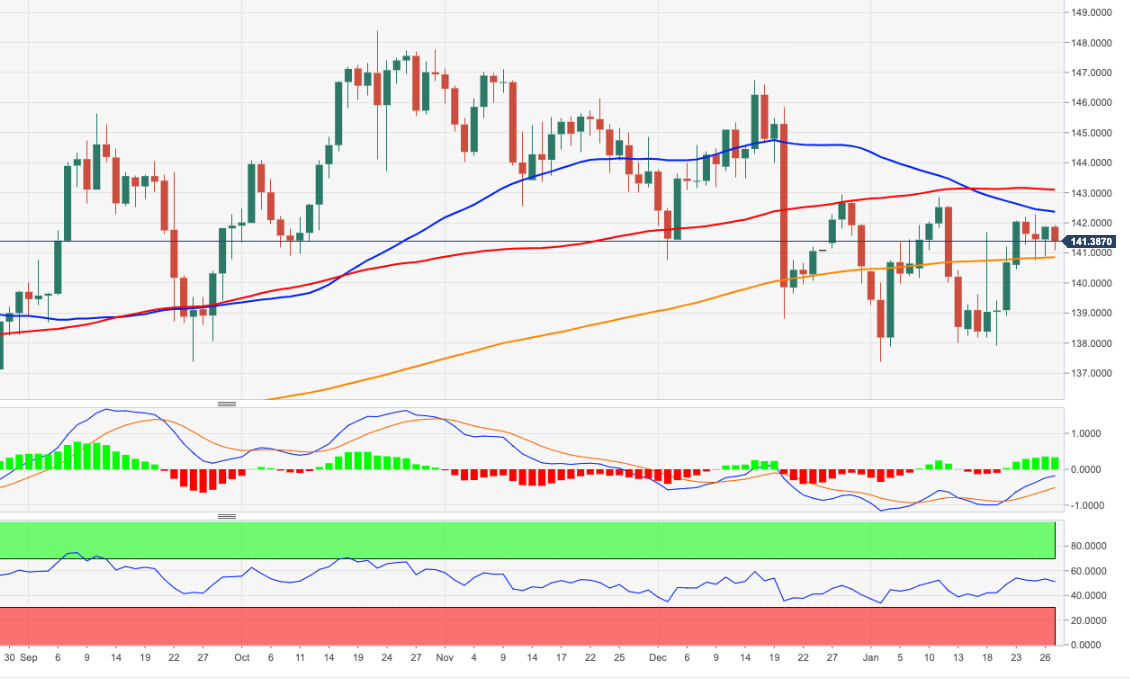
A continuation of consolidation in the short term should not be ruled out. Should the decline accelerate, the next support to watch is the 200-day SMA at 140.82 today. A sustainable drop below the latter would expose the cross to further weakness to initially the 138.00 area.
The constructive outlook for the EUR/JPY looks unchanged from continuing above the 200-day SMA.
EUR/JPY day chart
Source: Fx Street
I am Joshua Winder, a senior-level journalist and editor at World Stock Market. I specialize in covering news related to the stock market and economic trends. With more than 8 years of experience in this field, I have become an expert in financial reporting.


