
- The shared coin is up 1.17% on the week.
- Market traders’ sentiment turned positive, although it could fluctuate at any time.
The EUR/JPY is rising to 7-year highs, to a level last seen in January 2015, around 142.06, although Euro bulls are taking a breather as EUR/JPY remains positive below 142.00. At 141.88, EUR/JPY reflects the mixed mood of investors as US equities fluctuate.
Investor sentiment is fragile and fluctuates between positive and negative. Stocks recently shrugged off fears of the world central bank tightening monetary conditions and the possibility of the US slipping into recession.
On Tuesday, the EUR/JPY pair opened around 141.00. Until the end of the Asian session and the beginning of the European one, EUR/JPY rallied strongly towards the 7-year high at 142.06, then pulled back to the R1 daily pivot point at 141.50.
EUR/JPY Price Forecast: Technical Outlook
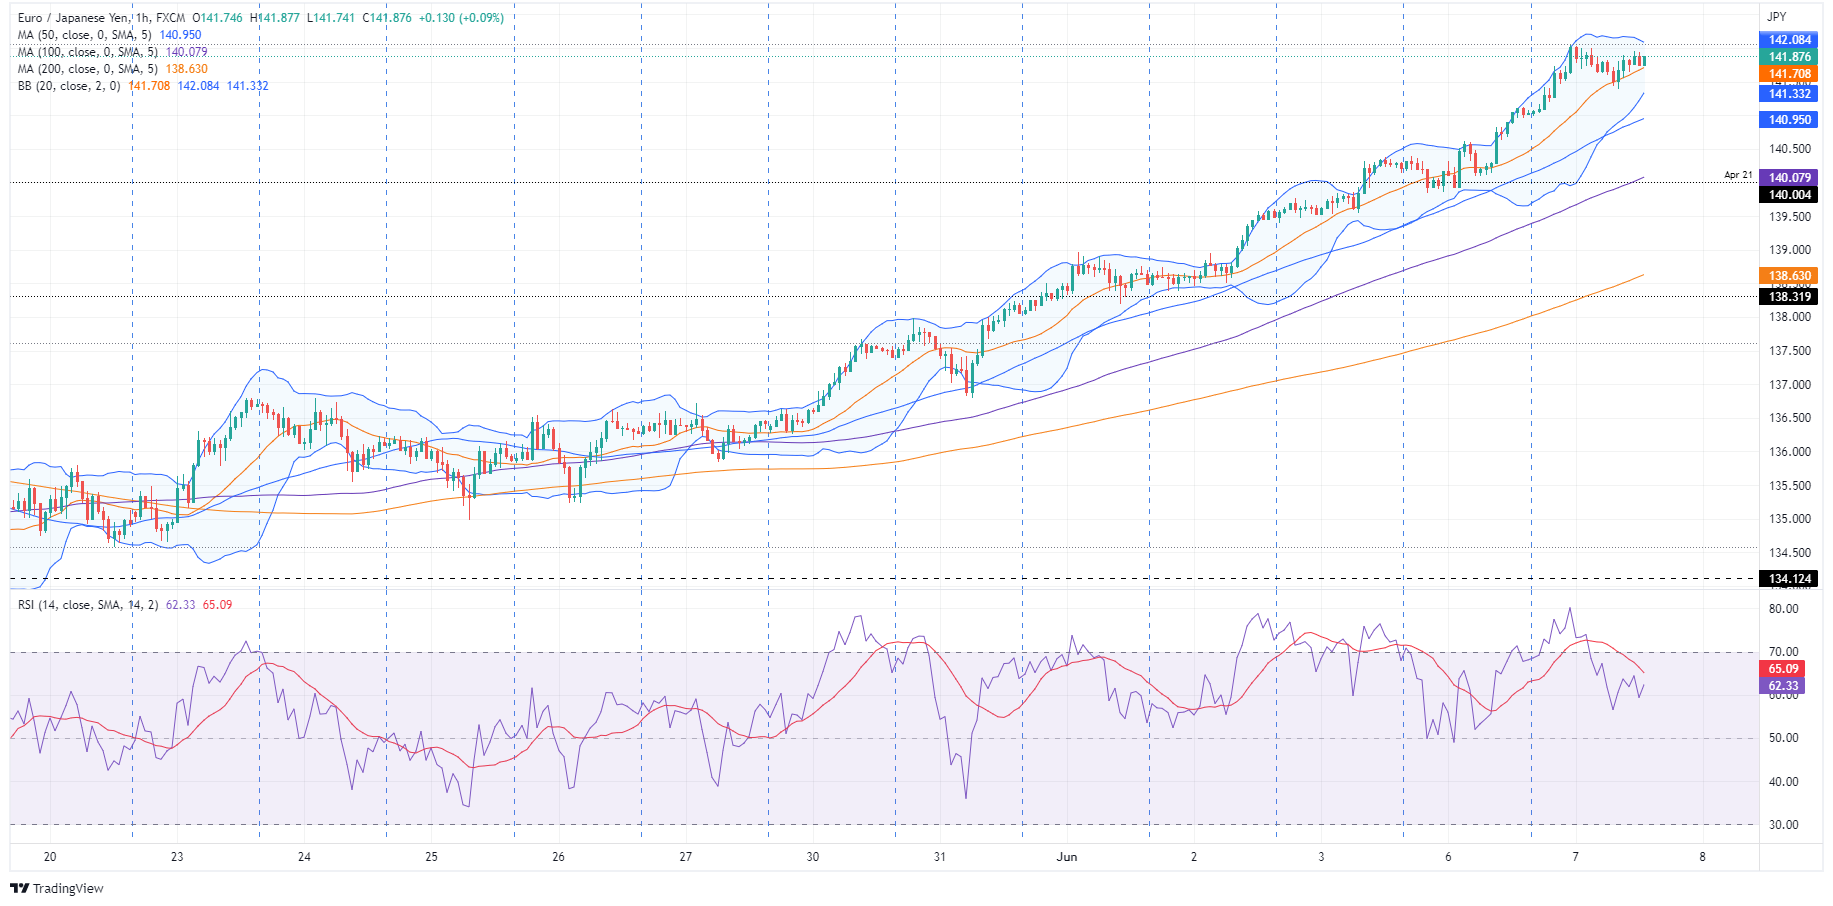
From the perspective of the EUR/JPY daily chart, the cross has a bullish bias. However, the Bollinger Band, along with the Relative Strength Index (RSI) shows that volatility has increased considerably. Indeed, EUR/JPY is in overbought territory, as shown by the RSI above 70, which opens the door for a mean reversal move before resuming the current bias.
In the short term, the EUR/JPY 1 hour chart shows the cross consolidating at the high 141.00, near the 142.00 area, forming a top that could evolve into a double top chart pattern. Furthermore, the EUR/JPY is putting pressure on the 20-hour Simple Moving Average (SMA), which, once breached, would see the EUR/JPY fall towards the 50-hour SMA at 140.94. A break below would expose the 100 hourly SMA at 140.07.
Technical levels
Source: Fx Street
With 6 years of experience, I bring to the table captivating and informative writing in the world news category. My expertise covers a range of industries, including tourism, technology, forex and stocks. From brief social media posts to in-depth articles, I am dedicated to creating compelling content for various platforms.


