
- EUR/JPY is under some pressure and is losing ground after two consecutive daily gains.
- There is still room for a possible bounce towards the 144.00 area.
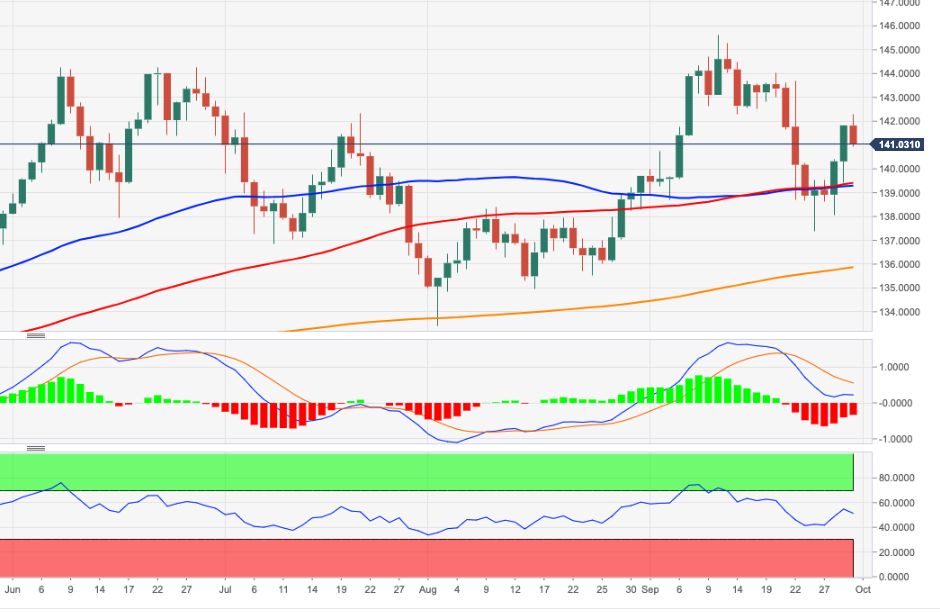
EUR/JPY appears to have found decent resistance around daily highs near 142.30 at the end of the week and quarter.
A continuation of the bounce from last week’s lows is still on the table in the very short term. That said, the cross could extend the bullish attempt towards the weekly high at 144.04 (Sep 20), which is seen as the last defense for a move to the 2022 high at 145.63 (Sep 12).
Meanwhile, if it remains above the key 200-day SMA at 135.84, the constructive outlook for the cross should remain unchanged.
EUR/JPY day chart
Source: Fx Street
With 6 years of experience, I bring to the table captivating and informative writing in the world news category. My expertise covers a range of industries, including tourism, technology, forex and stocks. From brief social media posts to in-depth articles, I am dedicated to creating compelling content for various platforms.


