
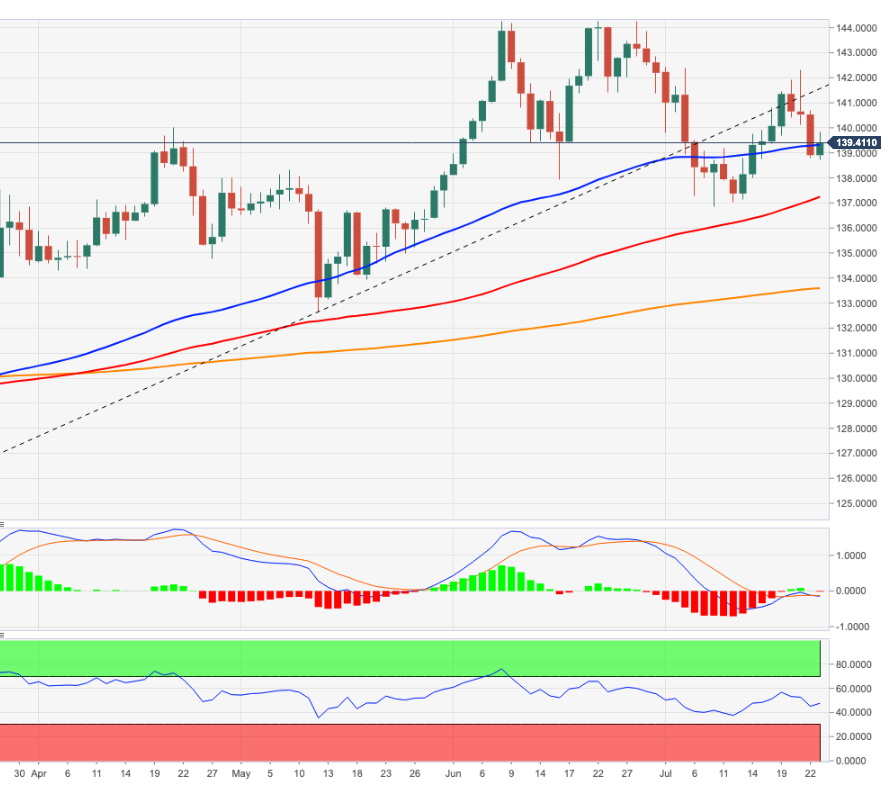
- EUR/JPY reverses three daily pullbacks and approaches 140.00.
- The four-month resistance line around the 141.50 area caps the upside.
EUR/JPY manages to recover somewhat for now and flirts with the 140.00 area after three losing daily sessions.
As long as it is below the four-month resistance line near 141.50, losses should continue and another drop to July’s low at 136.85 (8 Jul) should not be ruled out.
In the long term, the constructive stance on the cross remains well supported by the 200 SMA at 133.56.
EUR/JPY day chart
Source: Fx Street
With 6 years of experience, I bring to the table captivating and informative writing in the world news category. My expertise covers a range of industries, including tourism, technology, forex and stocks. From brief social media posts to in-depth articles, I am dedicated to creating compelling content for various platforms.


