
- Market sentiment is positive, although it is worth noting that China’s battle against Covid-19 could outweigh risk appetite and change sentiment negatively.
- EUR/JPY Price Forecast: Head-Shoulders Pattern Dim Prospects for EUR Higher.
The EUR/JPY it remains stuck in the 136.50-138.00 range for the third consecutive trading session, although it breaks two successive losing days and prints decent 0.19% gains in the American session. At 137.01, the EUR/JPY reflects a positive market sentiment in general.
Global stocks rose on Tuesday, while bond yields rose, with the exception of US Treasuries. In the commodities segment, precious metals rise and crude oil falls. China remains under pressure as the Covid-19 outbreak lasts longer than anticipated as authorities in Shanghai may reinstate stricter measures again. Additionally, Fitch Rating cut China’s growth outlook to 4.3% from 4.8% amid Beijing’s zero-tolerance program.
Meanwhile, EUR/JPY remains capped by action from higher EUR/USD, which remains confined to the 1.0500-70 range ahead of a crucial Fed policy meeting.
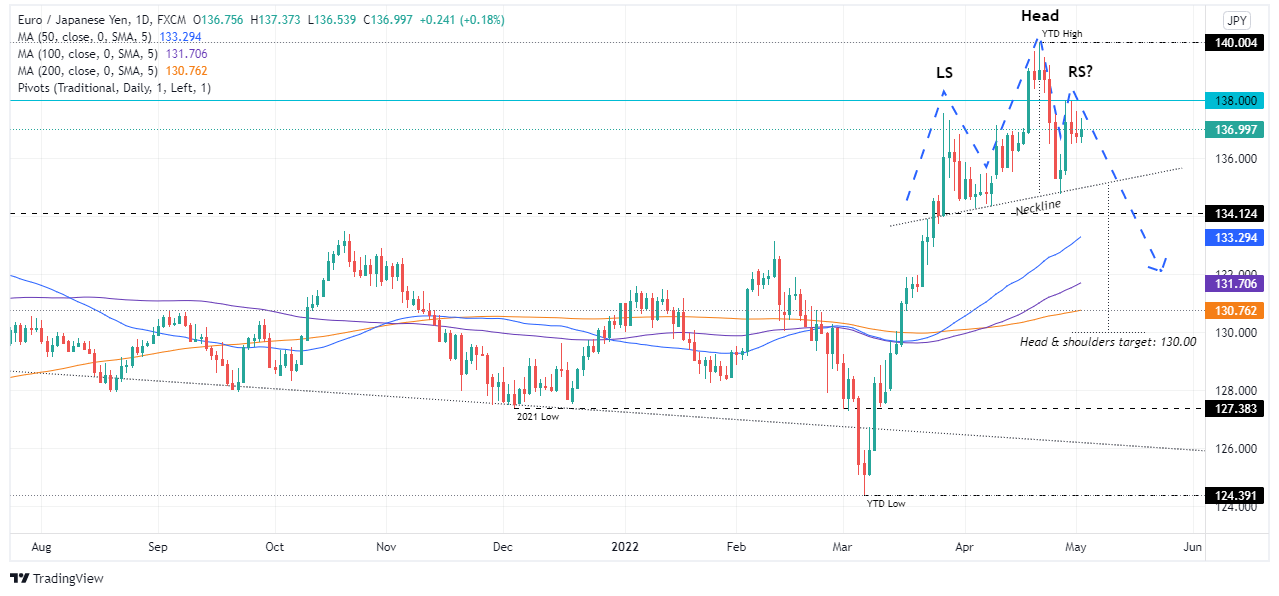
EUR/JPY Price Forecast: Technical Outlook
EUR/JPY continues to be threatened by a head and shoulders chart pattern on the daily chart. Although it could be invalidated, once EUR/JPY breaks above 140.00, that scenario is unlikely as central banks linked to them remain dovish. Additionally, the JPY’s presence in the cross leaves it subject to market sentiment, which could send the pair lower if it turns negative.
That said, the first support for the EUR/JPY would be the 137.00 level. If the EUR/JPY bears break that level, that will expose the 136.00 figure, followed by the head and shoulders neckline around 135.00-20.
Technical levels
EUR/JPY
| Panorama | |
|---|---|
| Last Price Today | 137.05 |
| Today’s Daily Change | 0.34 |
| Today’s Daily Change % | 0.25 |
| Today’s Daily Opening | 136.71 |
| Trends | |
|---|---|
| 20 Daily SMA | 136.65 |
| 50 Daily SMA | 133.18 |
| 100 Daily SMA | 131.64 |
| 200 Daily SMA | 130.76 |
| levels | |
|---|---|
| Previous Daily High | 137.64 |
| Previous Daily Minimum | 136.52 |
| Previous Maximum Weekly | 139.19 |
| Previous Weekly Minimum | 134.78 |
| Monthly Prior Maximum | 140 |
| Previous Monthly Minimum | 134.3 |
| Daily Fibonacci 38.2% | 136.95 |
| Daily Fibonacci 61.8% | 137.21 |
| Daily Pivot Point S1 | 136.27 |
| Daily Pivot Point S2 | 135.84 |
| Daily Pivot Point S3 | 135.15 |
| Daily Pivot Point R1 | 137.39 |
| Daily Pivot Point R2 | 138.08 |
| Daily Pivot Point R3 | 138.51 |
Source: Fx Street
Donald-43Westbrook, a distinguished contributor at worldstockmarket, is celebrated for his exceptional prowess in article writing. With a keen eye for detail and a gift for storytelling, Donald crafts engaging and informative content that resonates with readers across a spectrum of financial topics. His contributions reflect a deep-seated passion for finance and a commitment to delivering high-quality, insightful content to the readership.


