
- EUR/JPY is under pressure after a new cycle high.
- The ongoing corrective decline could extend to the 138.70 area.
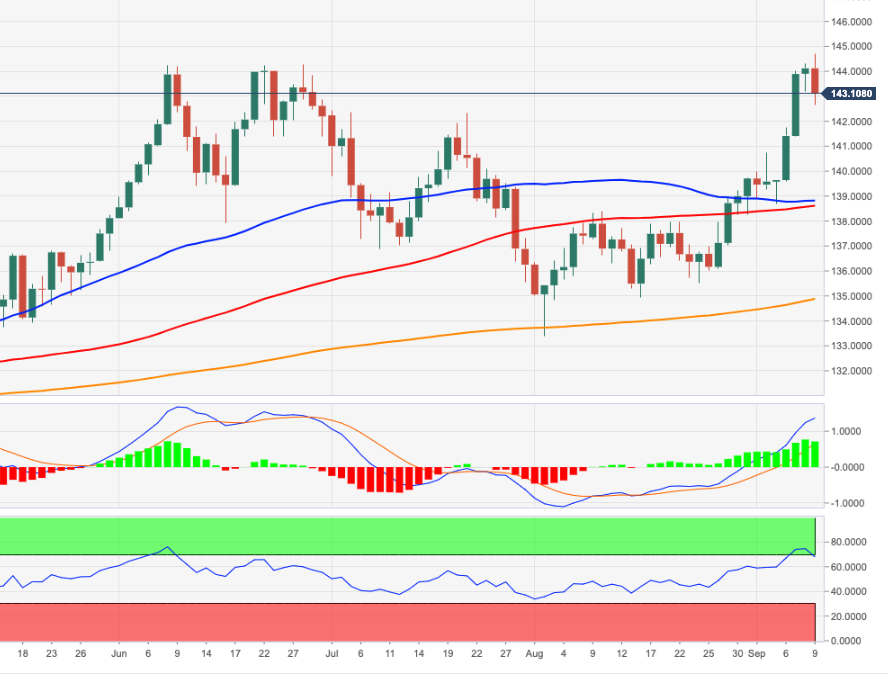
The EUR/JPY it is moving towards fresh highs near 144.70, an area where it last traded in January 2015, before embarking on a corrective decline.
The cross breaks out of overbought territory and the ongoing technical move carries the potential to extend into the 138.70 region, an area coincident with the September low and the 55-day SMA.
Meanwhile, as long as it is above the 200-day SMA at 134.84, the outlook for the pair should remain constructive.
EUR/JPY daily chart
Technical levels
Source: Fx Street
With 6 years of experience, I bring to the table captivating and informative writing in the world news category. My expertise covers a range of industries, including tourism, technology, forex and stocks. From brief social media posts to in-depth articles, I am dedicated to creating compelling content for various platforms.


