
- The EUR/JPY pair has reached a major resistance zone at 144.00.
- The daily chart shows a bullish triangle formation.
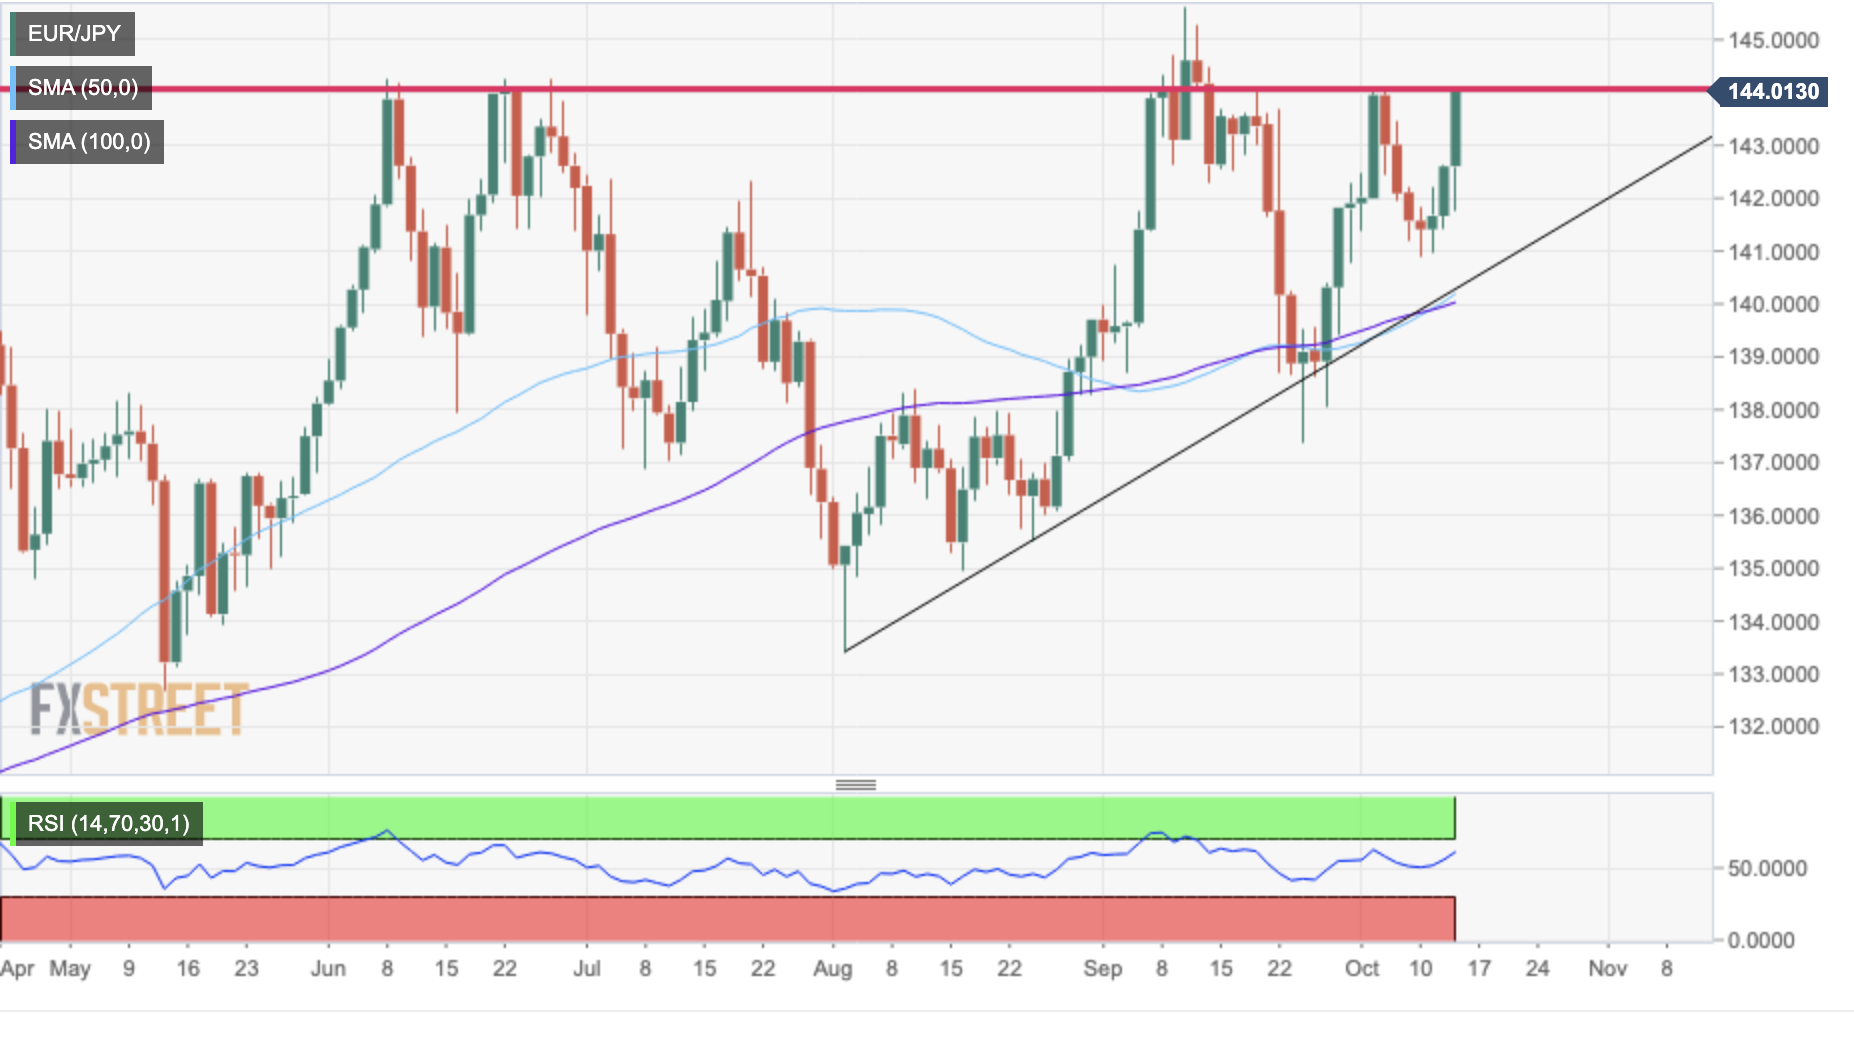
The EUR appreciates on Thursday for the third day in a row, to retrace last week’s reversal and return to a key resistance zone at 144.00, which is being tested at the time of writing.
The pair is right now at the point where the bulls were capped at the beginning of October, on the 20th of September, and also on the 20th, 22nd, 23rd and 28th of June. That resistance line and the uptrend line support from the early August lows are forming an ascending triangle pattern.
Furthermore, the 50 and 10-day moving averages present a bullish crossover, while the RSI shows some margin before reaching overbought levels.
This could encourage the bulls to break above the mentioned 144.00, aiming to reach the 12th Sep high at 145.65 ahead of the 2014 high at 149.65.
To the downside, immediate support lies at 140.85 (10th Oct low) before trendline support at 140.35. Once below here, the bears could take control, pushing the pair towards the September lows at 137.30.
EUR/JPY daily chart
Technical levels to watch
Source: Fx Street
With 6 years of experience, I bring to the table captivating and informative writing in the world news category. My expertise covers a range of industries, including tourism, technology, forex and stocks. From brief social media posts to in-depth articles, I am dedicated to creating compelling content for various platforms.


