
- EUR/JPY falls to multi-day lows in the area below 162.00.
- Further south is the 55-day SMA near 158.90.
He EUR/JPY extends its fall below the 162.00 support at the beginning of the week.
On the short-term horizon, the cross could continue to fall. That said, losses could accelerate towards the interim 55-day SMA at 158.87 before the interim 100-day SMA at 158.02.
For now, the positive long-term outlook for the cross seems favored as long as it remains above the 200-day SMA, today at 152.79.
EUR/JPY Daily Chart
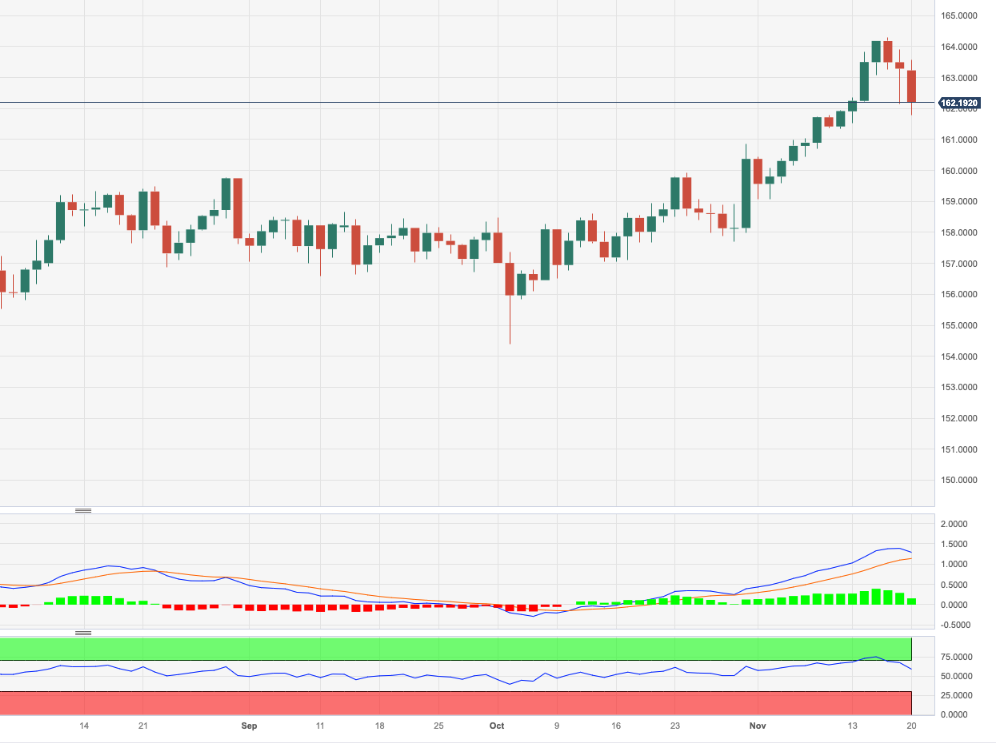
Source: Fx Street
I am Joshua Winder, a senior-level journalist and editor at World Stock Market. I specialize in covering news related to the stock market and economic trends. With more than 8 years of experience in this field, I have become an expert in financial reporting.


