
- The EUR/JPY pair is under some pressure after the recent yearly highs.
- The continuation of the uptrend remains centered at 146.70.
He USD/JPY retraces some of Wednesday’s advance towards fresh 2023 highs past the 143.00 hurdle on Thursday.
Although the cross looks broadly sideways at the moment, a convincing break of the upper end of the range near 143.50 could trigger a move higher to initially the December 2022 high at 146.72 (Dec 15).
Meanwhile, as long as it holds above the 200-day SMA, today at 141.17, the outlook for the cross is expected to remain positive.
EUR/JPY daily chart
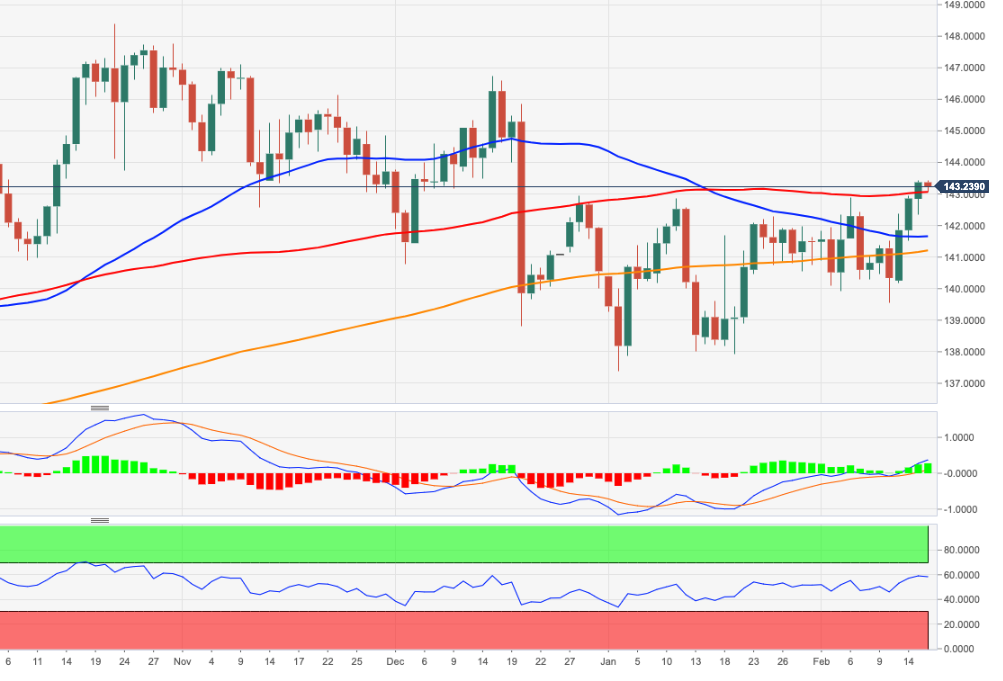
Source: Fx Street
I am Joshua Winder, a senior-level journalist and editor at World Stock Market. I specialize in covering news related to the stock market and economic trends. With more than 8 years of experience in this field, I have become an expert in financial reporting.


