
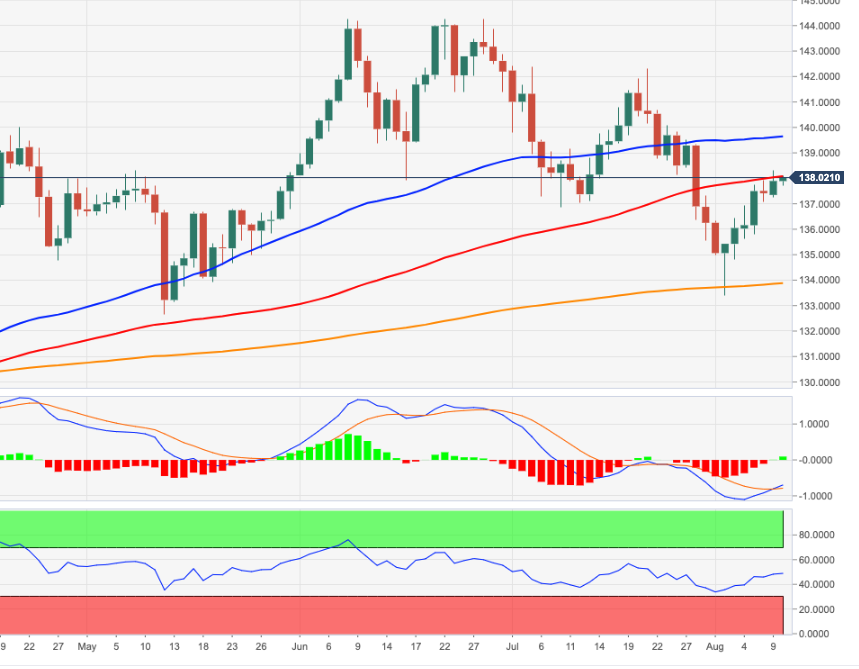
- EUR/JPY continues to rise and is trading around 138.00.
- Further rallies would test the 55-day moving average around 139.60.
EUR/JPY continues the uptrend for one more session and hovers around the 138.00 area.
Considering the ongoing price action, it seems likely that the cross will continue to rise for the time being. That said, the next temporary target lines up at the 55 day SMA today at 139.61. If the cross breaks above this area, it could open the door for a likely visit to July’s high at 142.32 (July 21).
As long as it is above the 200 SMA at 133.84, the outlook for the cross is expected to remain constructive. This zone of contention also appears to be underpinned by the approach of the August low at 133.39 (Aug 2).
EUR/JPY day chart
Source: Fx Street
With 6 years of experience, I bring to the table captivating and informative writing in the world news category. My expertise covers a range of industries, including tourism, technology, forex and stocks. From brief social media posts to in-depth articles, I am dedicated to creating compelling content for various platforms.


