
- EUR/JPY moderated two consecutive daily declines on Wednesday.
- The resistance line around 140.00 caps the upside so far.
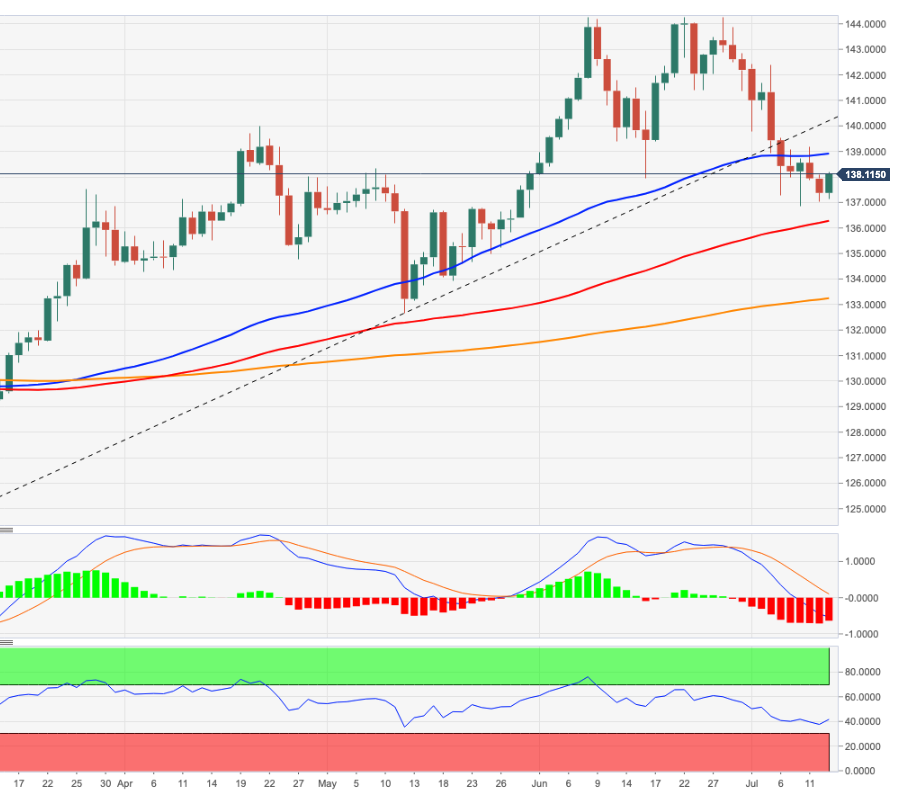
The EUR/JPY manages to gather some traction to the upside around 138.00 on Wednesday.
Meanwhile, the cross remains under pressure amid the ongoing bounce from July lows in the 136.80 region (8 Jul). As long as the cross continues to trade below the 4-month resistance line around 140.00, further losses should remain in the pipeline.
That said, continuation of the downtrend could revisit the 100-Day SMA at 136.24 ahead of minor support at 133.92 (low May 19).
In the long term, the constructive stance on the cross remains well supported by the 200-day SMA at 133.21.
EUR/JPY daily chart
Technical levels
Source: Fx Street
With 6 years of experience, I bring to the table captivating and informative writing in the world news category. My expertise covers a range of industries, including tourism, technology, forex and stocks. From brief social media posts to in-depth articles, I am dedicated to creating compelling content for various platforms.


