
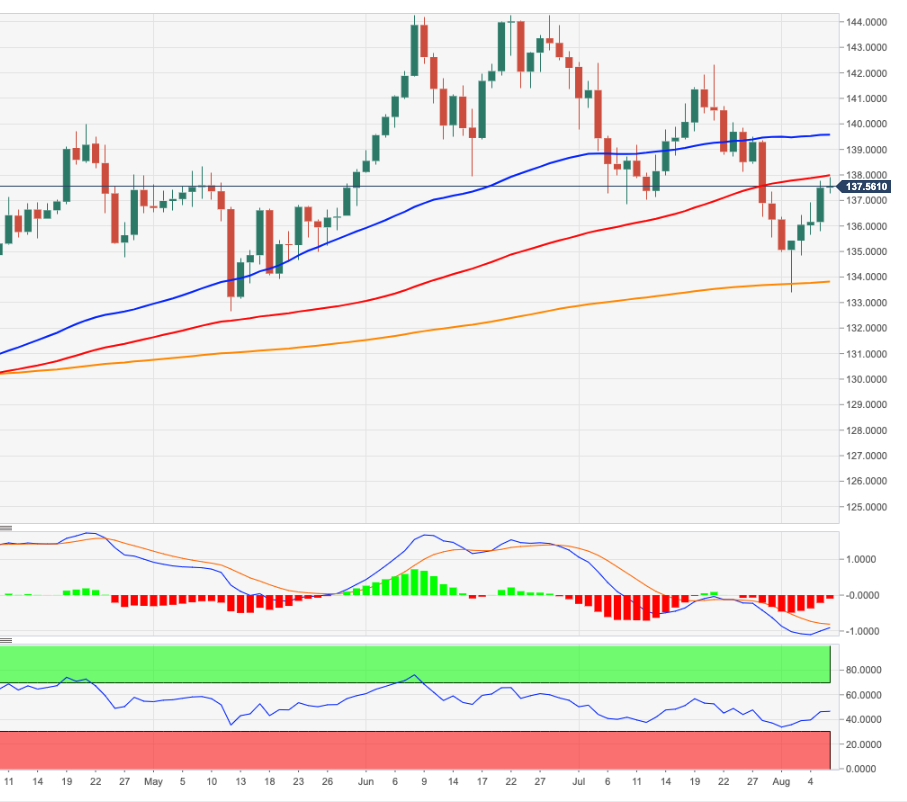
- EUR/JPY extends its recovery to 138.00 on Monday.
- Further above, the intermediate 55-day SMA now emerges around 139.50.
The EUR/JPY still in recovery mode and already flirting with the 138.00 zone at the beginning of the week.
Given the ongoing price action, it seems likely that the cross will continue to rise for the time being. That said, the next temporary target is the 55-day SMA today at 139.54.
As long as it is above the 200-day SMA at 133.79, the outlook for the cross is expected to remain constructive.
EUR/JPY daily chart
Technical levels
Source: Fx Street
With 6 years of experience, I bring to the table captivating and informative writing in the world news category. My expertise covers a range of industries, including tourism, technology, forex and stocks. From brief social media posts to in-depth articles, I am dedicated to creating compelling content for various platforms.


![News and prognosis of the price of the pound sterling: the GBP/USD earns even when the unemployment rate in the United Kingdom is accelerated [Video]](https://editorial.fxsstatic.com/images/i/gbp-usd-001_Large.jpg "News and prognosis of the price of the pound sterling: the GBP/USD earns even when the unemployment rate in the United Kingdom is accelerated [Video]")


