
- EUR/JPY fell on Friday near 163.10 after a 0.72% drop on the day.
- The pair’s price action plummeted to 163.00 after facing a rejection at the SMA of 164.00.
- The MACD and RSI technical indicators signaled increasing selling pressure, contributing to the pair’s downtrend.
The EUR/JPY currency pair saw a significant drop on Friday, losing 0.72% to hit a low of 163.10. Prior to this drop, the pair faced resistance at the Simple Moving Average (SMA) of 164.00, which contributed to its downward move.
The technical indicators used in this analysis, namely the MACD and the Relative Strength Index (RSI), further underline the bearish sentiment surrounding the EUR/JPY pair. The red coloring of the MACD histogram and its increasing size point to increasing selling pressure, corroborated by the position of the MACD line below the signal line. The RSI, with a value of 43, resides in negative territory and exhibits a sharply declining slope, indicating an increase in selling pressure.
The probable continuation of the pair’s downward trajectory is suggested by its trading below the resistance level of 163.50. Furthermore, the support levels at 163.00, 162.50 and 162.00 deserve attention, while the resistance levels at 164.00, 164.50 and 165.00 should be monitored.
EUR/JPY Daily Chart
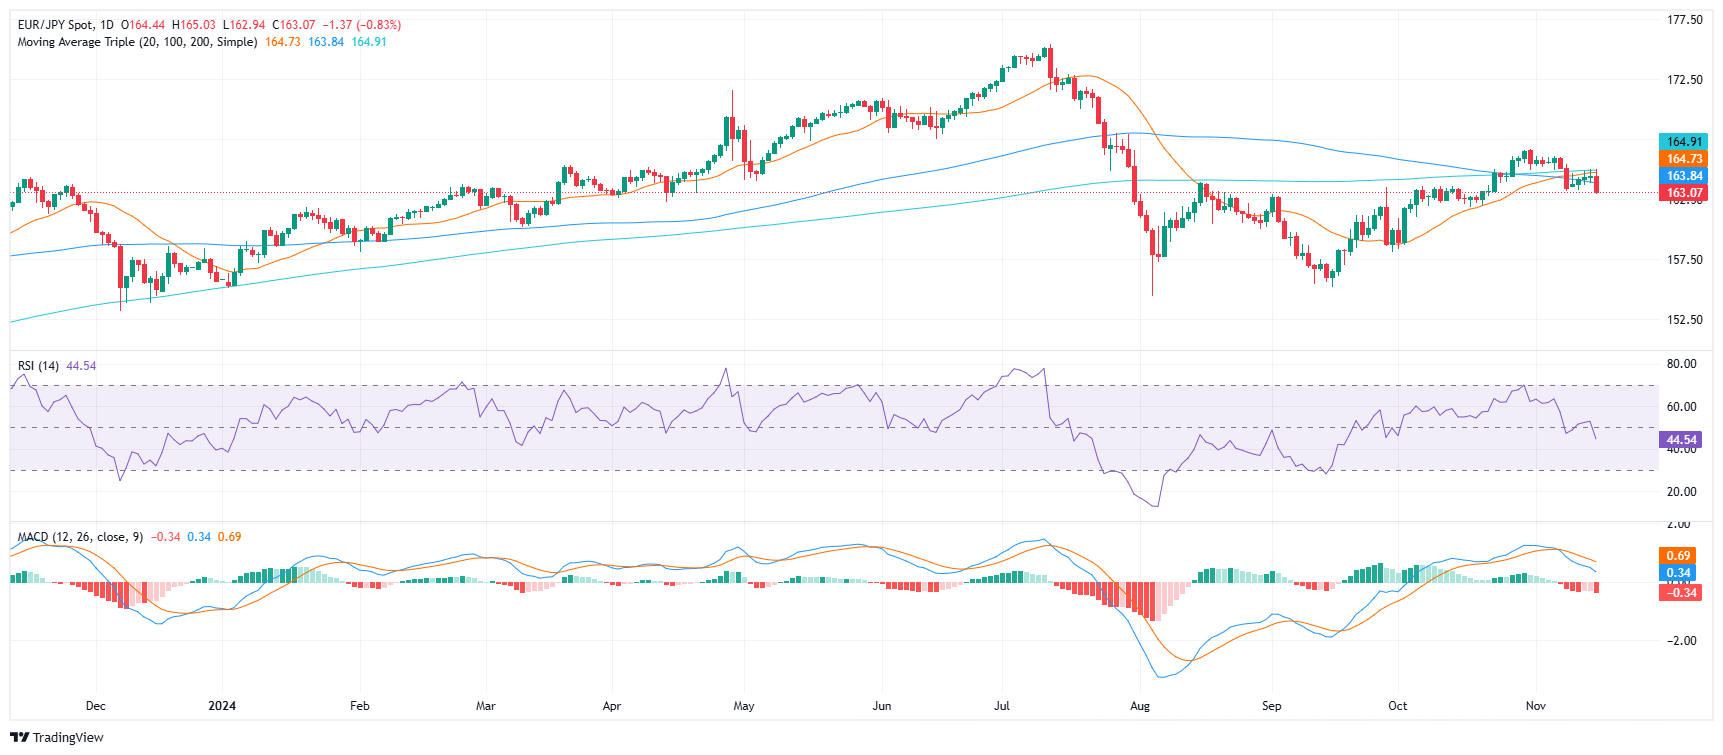
Source: Fx Street
I am Joshua Winder, a senior-level journalist and editor at World Stock Market. I specialize in covering news related to the stock market and economic trends. With more than 8 years of experience in this field, I have become an expert in financial reporting.


