
- EUR/JPY bulls regain control and prepare to target 138.00.
- Sentiment has improved as China is about to ease some Covid-19 restrictions in Beijing and Shanghai.
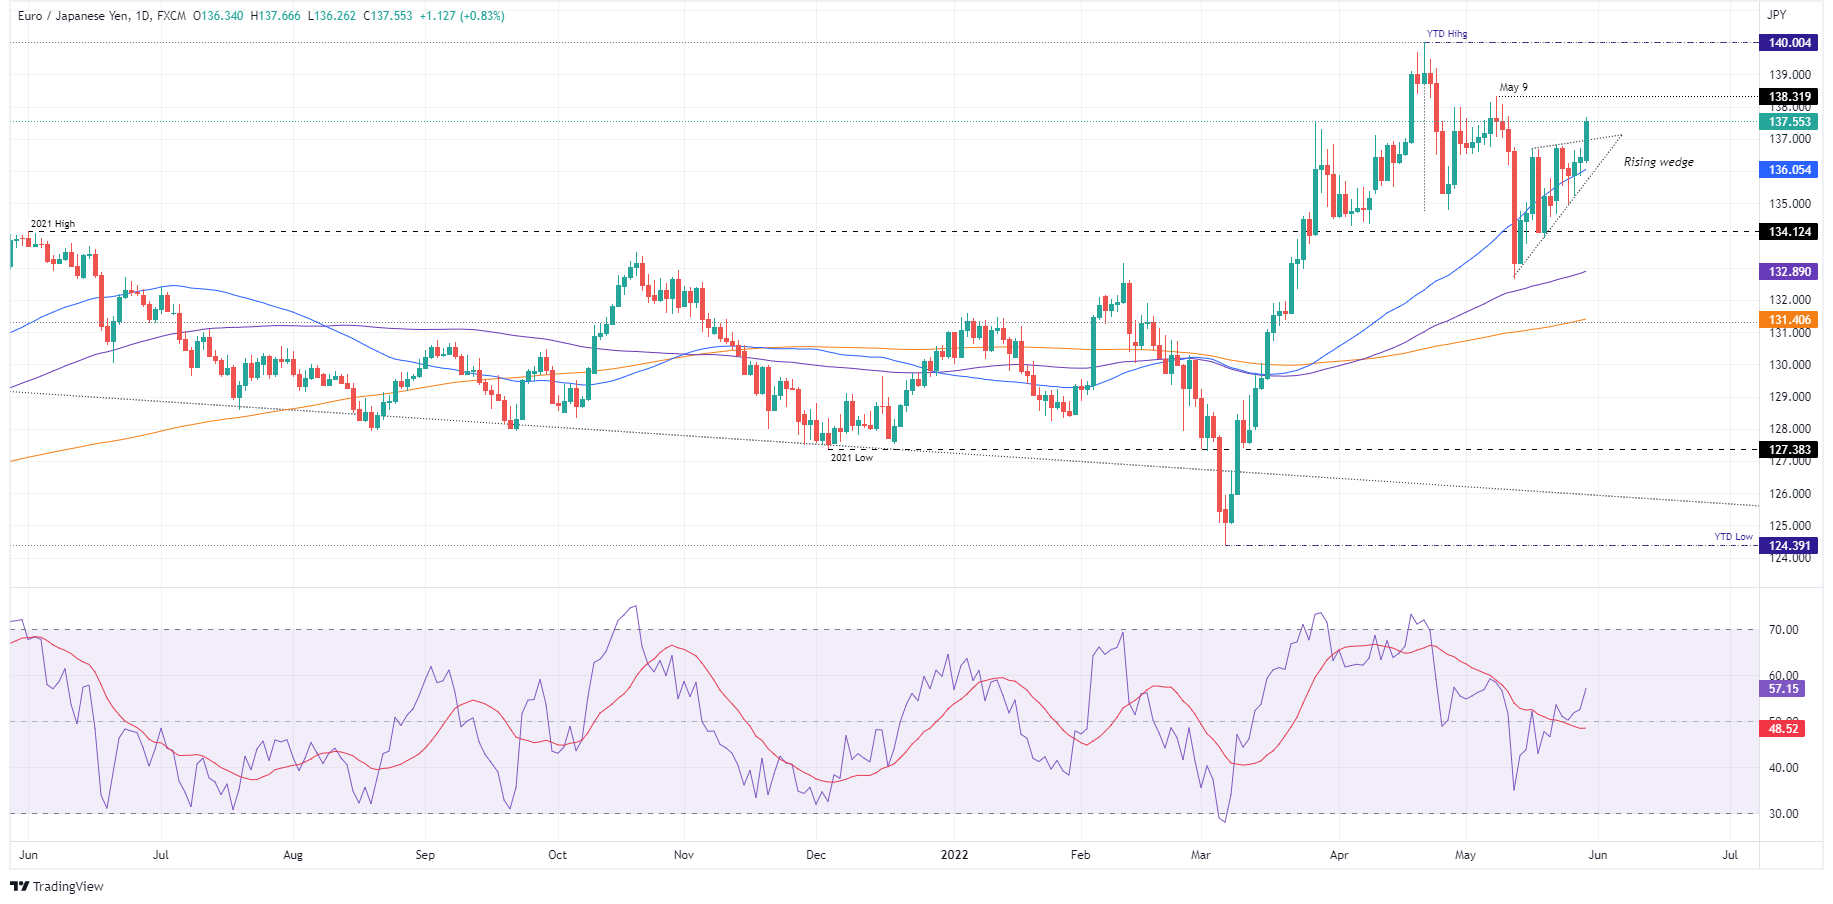
- EUR/JPY Price Analysis: Rising Wedge breakout to the upside and RSI in bullish territory puts bullish pressure on the currency pair.
The EUR/JPY breaks above the top of the rising wedge, invalidating the chart pattern, and hits a 3-week high around the 137.50 area on the back of improving market sentiment and weak haven currencies . At the 137.55 zone, the EUR/JPY reaches daily highs in the American session.
EUR/JPY rises on positive sentiment and expectations of a less aggressive Fed in the US.
Asian and European stocks closed higher. As Wall Street is closed, US stock futures are trading in the green. Concerns about the coronavirus outbreak in China are easing as Beijing and Shanghai prepare to relax some restrictions on Wednesday, aimed at boosting economic activity in the second-largest economy. Adding to the expectations noted above, some central banks, notably the US Federal Reserve, could slow rate hikes as investors scaled back aggressive bets on Fed tightening.
Elsewhere, Monday’s EUR/JPY price action opened near daily lows around 136.30 and rallied close to 100 pips, breaking the upper trend line of the bullish wedge around at 137.00, while EUR/JPY bulls head towards 138.00 and beyond.
EUR/JPY Price Analysis: Technical Outlook
EUR/JPY broke out of the rising wedge to the upside, exposing the currency to further gains. EUR/JPY bulls regained control as evidenced by the Daily Moving Averages (DMA) below the exchange rate and the Relative Strength Index (RSI) pointing lower as EUR/USD retraced from May 9 high at 138.32 towards May 12 low at 132.89, is now in bullish territory at 57.13.
That said, the first resistance for the EUR/JPY would be the 138.00 mark. A break above would expose the May 9 high at 138.32. Once broken, the next EUR/JPY supply zone would be the year’s high at 140.00.
Technical levels
Source: Fx Street
With 6 years of experience, I bring to the table captivating and informative writing in the world news category. My expertise covers a range of industries, including tourism, technology, forex and stocks. From brief social media posts to in-depth articles, I am dedicated to creating compelling content for various platforms.


