
- EUR/JPY extends downside correction below 142.00.
- Above 138.60, the cross is likely to continue moving higher.
The EUR/JPY falls for the third session in a row on Thursday, this time breaking below key support at 142.00.
Despite the ongoing correction, the bullish bias on the cross remains as long as the support line around 138.60 holds the downside. This containment zone is currently reinforced by the 55-day SMA.
The resumption of the bullish bias could bring the year’s high at 144.27 (June 28) back on the radar ahead of the round level at 145.00 and before the 2015 high at 145.32 (Jan 2).
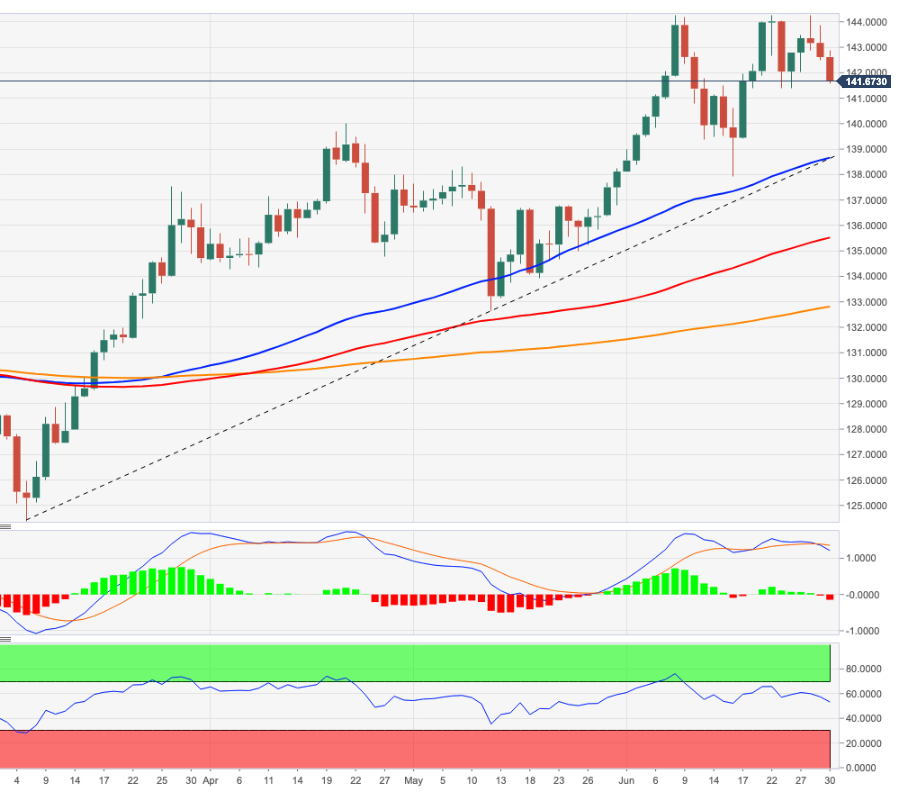
EUR/JPY daily chart
Technical levels
Source: Fx Street
With 6 years of experience, I bring to the table captivating and informative writing in the world news category. My expertise covers a range of industries, including tourism, technology, forex and stocks. From brief social media posts to in-depth articles, I am dedicated to creating compelling content for various platforms.


