
- EUR/JPY corrects sharply lower and breaks below 141.00.
- The 143.00 zone (28 Dec high) remains a tough hurdle for the bulls.
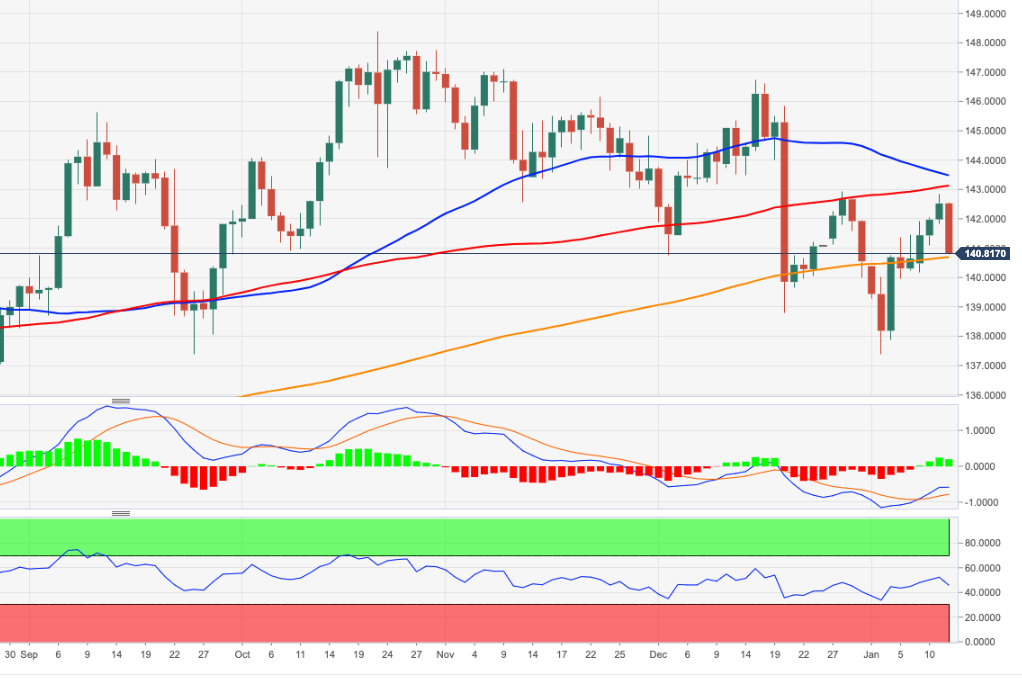
EUR/JPY notably reverses four consecutive daily advances and returns below 141.00 after being rejected from the vicinity of 143.00 on Wednesday.
Despite the ongoing bullish momentum, the short-term rally is still favored. Against, the immediate bullish barrier appears at the weekly high of 142.93 (December 28), which seems reinforced by the proximity to the 100-day simple moving average (SMA), today at 143.09.
The outlook for EUR/JPY should remain positive as long as it holds above the 200-day SMA at 140.65.
EUR/JPY day chart
Source: Fx Street
I am Joshua Winder, a senior-level journalist and editor at World Stock Market. I specialize in covering news related to the stock market and economic trends. With more than 8 years of experience in this field, I have become an expert in financial reporting.


