
- EUR/JPY maintains erratic behavior above 158.00.
- For the moment, it continues to consolidate.
He EUR/JPY regains bullish traction and puts aside Wednesday’s pullback, revisiting the 158.00 hurdle and above on Thursday.
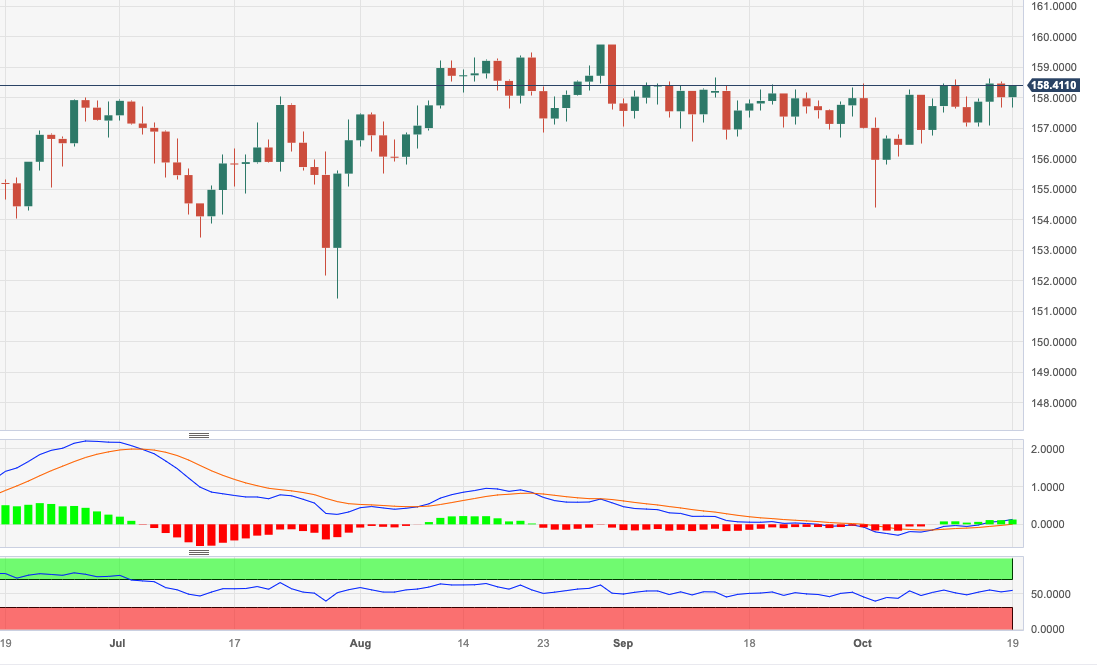
Given the current performance, it appears that the range-bound trade for the crossover is on the near-term horizon. Meanwhile, the break of this range could test the September high of 158.65 (September 13) before the 2023 high at 159.76 (August 30).
For now, the long-term positive outlook for the cross seems favorable as long as it remains above the 200-day SMA, today at 150.59.
EUR/JPY Daily Chart
Source: Fx Street
I am Joshua Winder, a senior-level journalist and editor at World Stock Market. I specialize in covering news related to the stock market and economic trends. With more than 8 years of experience in this field, I have become an expert in financial reporting.


")


