
- EUR/JPY falls 0.78% to a three-day low of 156.64 after the ECB raised rates by 25 basis points, but signals caution.
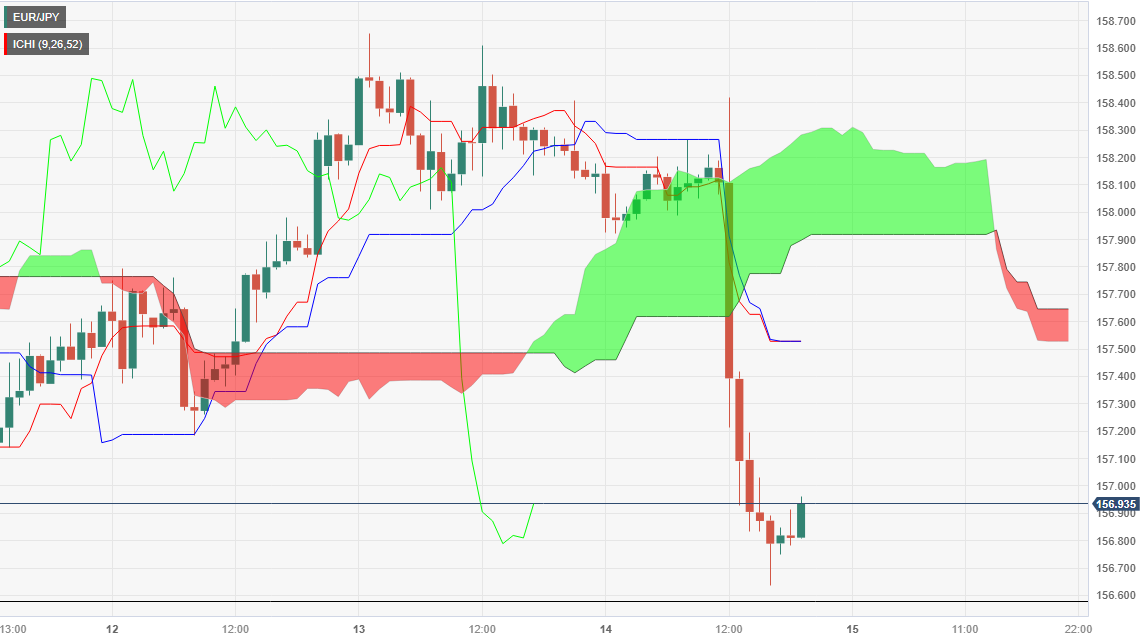
- Technical outlook turns bearish as Chikou Span crosses below price action and Tenkan-Sen falls below Kijun-Sen.
- The short-term battle is fought below 157.00; a daily close below could trigger a retest of the weekly low at 156.58.
Late in the American session, the pair USD/JPY fell sharply following the moderate rate hike by the European Central Bank (ECB), which raised rates by 25 basis points for the tenth time since the central bank began its tightening cycle. Thus, the currency pair extends its losses of 0.78%, falling to a new three-day low at 156.64, but far from a new weekly low. The pair trades at 156.91.
EUR/JPY Price Analysis: Technical Outlook
After reaching another lower low, the currency pair has a neutral bias, although it remains above the Ichimoku (Kumo) cloud, which is considered a bullish signal. However, the Chikou Span crossing below the price action and the Tenkan-Sen crossing below the Kijun-Sen give two bearish signals that, added to the market structure, portray the pair as slightly inclined to the downside. .
In the short term, the EUR/JPY hourly chart shows the pair at three-day lows, with bulls and bears battling just below the 157.00 area. If the pair manages a daily close below that level, a retest of the weekly low of 156.58 is expected before the cross extends its losses towards the 156.00 figure. On the other hand, if the currency pair ends the day above 157.00, an upward correction is seen towards 157.52/64, a confluence zone, where the Kijun-Sen, Tenkan-Sen, and the Senkou Span A and B are found before resuming their upward trend.
EUR/JPY hourly chart
Source: Fx Street
I am Joshua Winder, a senior-level journalist and editor at World Stock Market. I specialize in covering news related to the stock market and economic trends. With more than 8 years of experience in this field, I have become an expert in financial reporting.


