
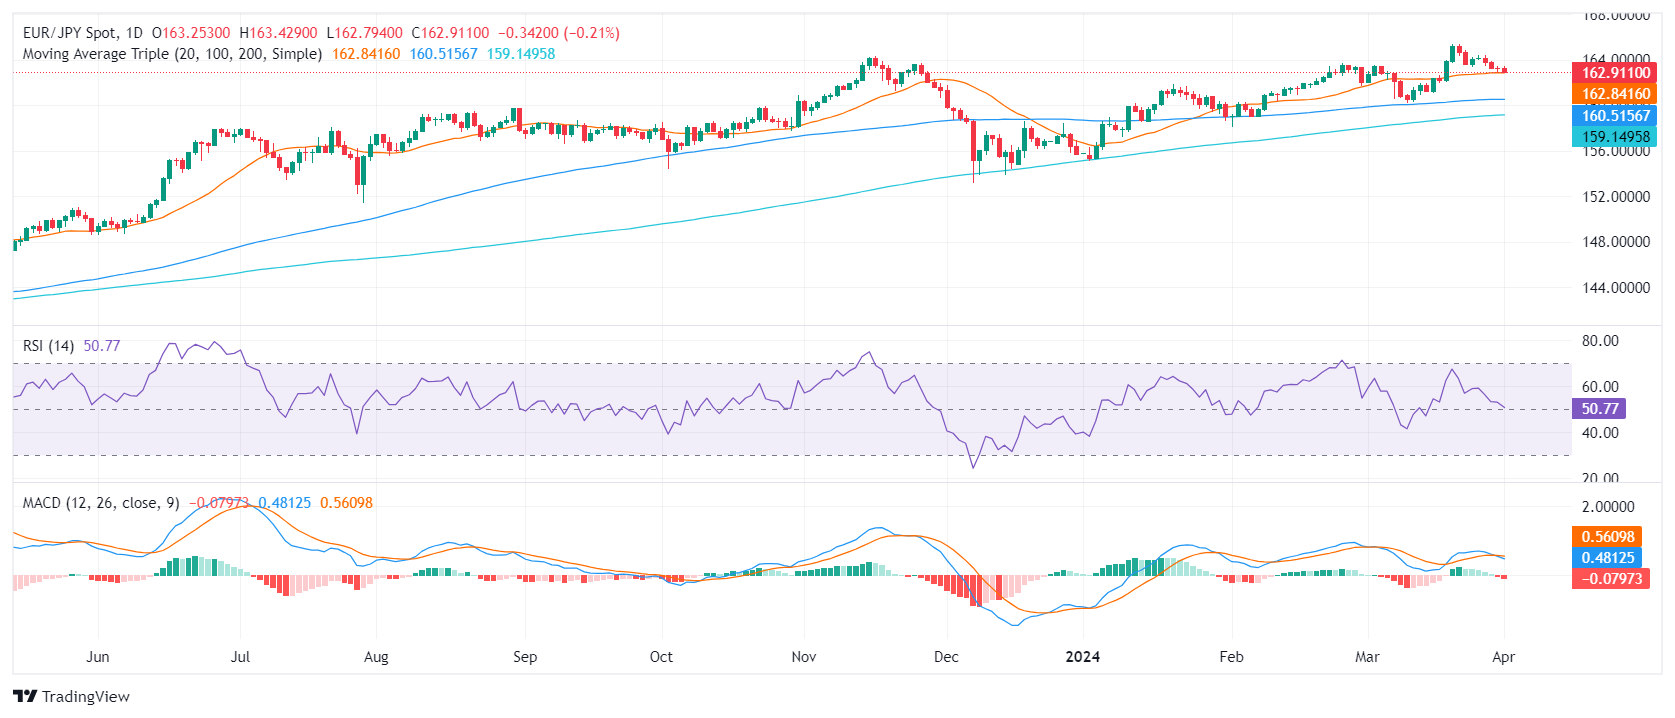
- The indicators on the daily chart show consistent buying momentum.
- Bulls must keep a lid on the current support around the 20-day SMA to avoid further losses.
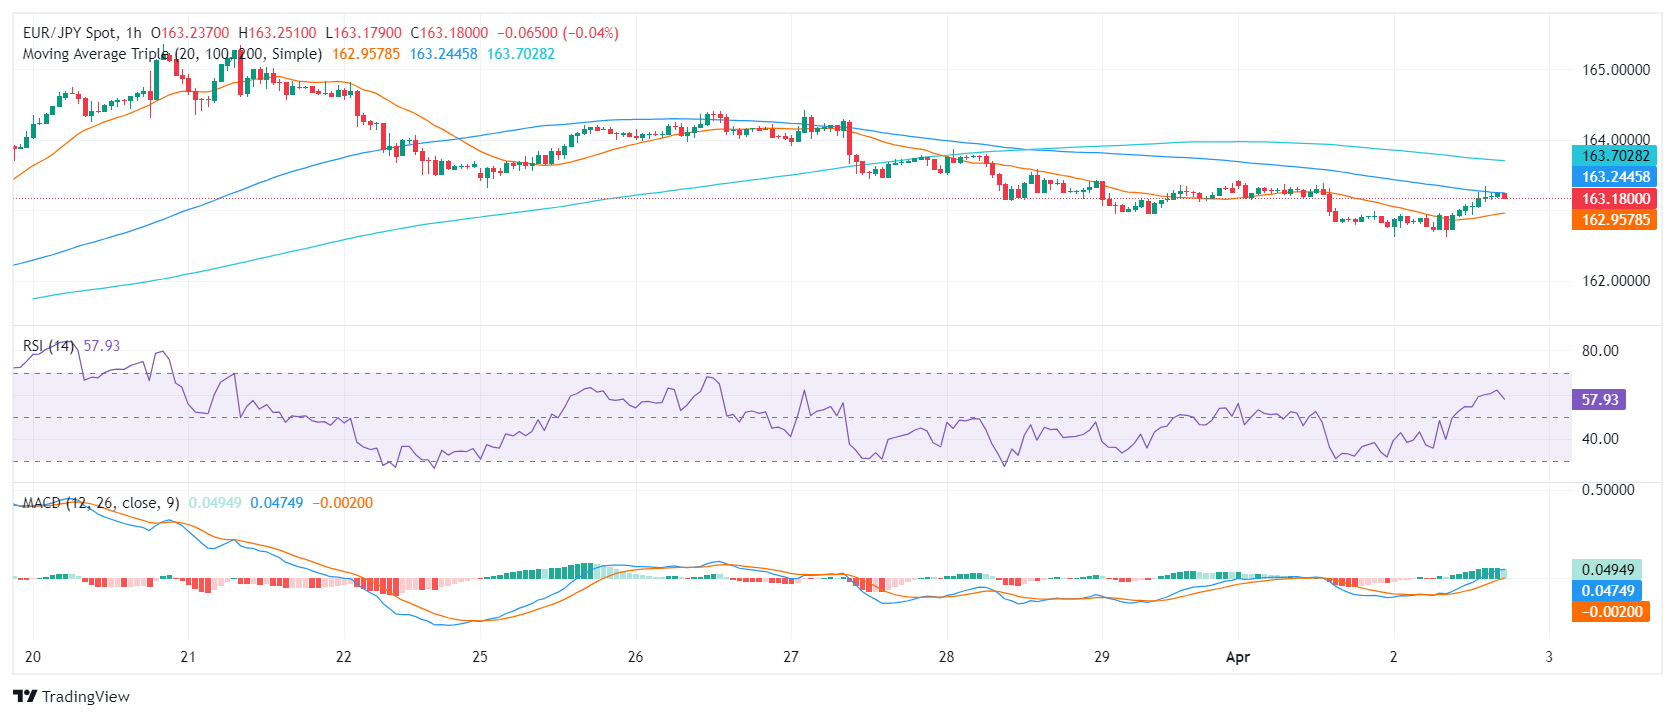
- Signs of recovery are seen on the hourly chart.
The EUR/JPY pair is currently hovering around the 163.20 mark, showing a slight increase in the Tuesday session. Persistent momentum suggests an advantage for bulls, but if the pair falls below the 20-day SMA, sellers are likely to force a momentum reversal.
On the daily chart, the EUR/JPY pair is in an uptrend. The Relative Strength Index (RSI) fluctuates in positive territory, reaching a high of 65 last week before falling to 52 in the most recent reading. The Moving Average Convergence Divergence (MACD) continues to show flat red bars, indicating slightly negative momentum.
EUR/JPY daily chart
On the hourly chart, sentiment is also positive. The RSI, which started the session from a low point in negative territory at 39, has since recovered strongly into positive territory with the most recent reading at 61. Reinforcing this positive trend, the MACD histogram creates green bars.
EUR/JPY hourly chart
In summary, the EUR/JPY pair is demonstrating an overall bullish bias amid minor pullbacks. Both the daily and hourly charts show positive sentiment, as indicated by the RSI and MACD values. Coupled with the pair above its 20,100 and 200-day SMA, the overall market tilt is leaning towards the bulls.
Source: Fx Street
I am Joshua Winder, a senior-level journalist and editor at World Stock Market. I specialize in covering news related to the stock market and economic trends. With more than 8 years of experience in this field, I have become an expert in financial reporting.


