
- The EUR/JPY pair rises 0.44%, extending its winning streak to seven days, amid positive market sentiment.
- The technical outlook remains bullish; The RSI is approaching overbought territory, indicating strong bullish momentum.
- Monitor resistance at the April 26 high at 169.39, 170.00 and the yearly high at 171.58.
- Key support levels at 169.00, 166.93/81 and 165.90.
During the North American session, the Euro extended its gains against the Japanese Yen in recent trading. Market sentiment remains optimistic; hence the EUR/JPY pair is trading with gains of 0.44%, at 169.27 at the time of writing this report.
EUR/JPY Price Analysis: Technical Outlook
From a technical point of view, EUR/JPY maintains its bullish bias, extending its gains for seven consecutive days, while fear that the Japanese authorities could intervene in the currency markets may limit the gains.
Momentum continues to favor the bullish trend, as the Relative Strength Index is in bullish territory and about to become overbought. However, due to the strength of the uptrend, the most extreme level would not be 70, as most traders would use 80.
That being said, the first key resistance level would be the April 26 high at 169.39. Once broken, the next line of defense for sellers would be the 170.00 level, followed by the yearly high at 171.58.
On the contrary, if EUR/JPY reverses and falls below 169.00, it could put bearish pressure on the cross. The first level of support would be the confluence of the Kijun-Sen and the Senkou Span A around 166.93/81, followed by the Tenkan-Sen at 166.68. Breaking this last level would expose the Senkou Span B at 165.90.
EUR/JPY Price Action – Daily Chart
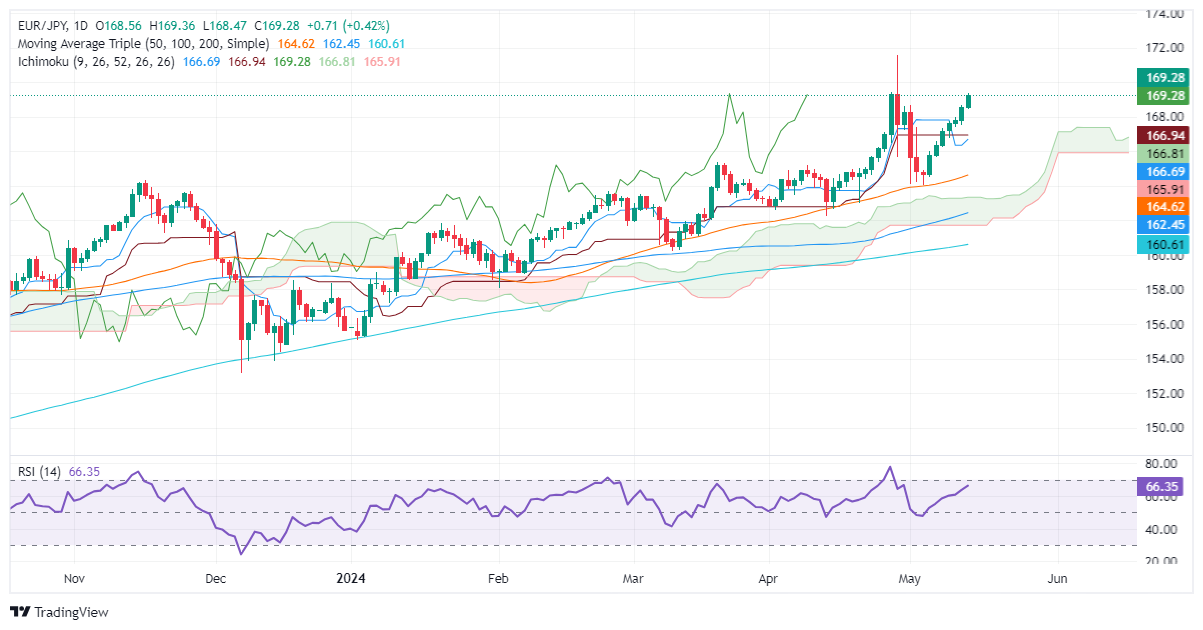
Source: Fx Street
I am Joshua Winder, a senior-level journalist and editor at World Stock Market. I specialize in covering news related to the stock market and economic trends. With more than 8 years of experience in this field, I have become an expert in financial reporting.


