
- The EUR/JPY cross could depreciate further as daily chart analysis suggests a prevailing bearish bias.
- A corrective move could be indicated once the 14-day RSI falls below the 30 level.
- The main support appears in the descending channel around the psychological level of 159.00.
EUR/JPY extends its losses for the second day in a row, trading around 159.60 during Asian hours on Wednesday. Technical analysis of the daily chart shows that the pair is moving lower within the descending channel pattern, suggesting an ongoing bearish bias.
Furthermore, the 14-day Relative Strength Index (RSI) is positioned slightly below the 30 level, confirming the bearish sentiment for the EUR/JPY cross. A drop below the 30 level would indicate an oversold situation and lead to a corrective bounce.
In terms of support, the EUR/JPY cross could find main support at the lower boundary of the descending channel around the psychological level of 159.00, followed by a two-month low of 158.10, recorded on September 30. A break below this level could strengthen the bearish sentiment and put downward pressure on the currency cross to navigate the area around its 11-month low of 154.41, recorded in December 2023.
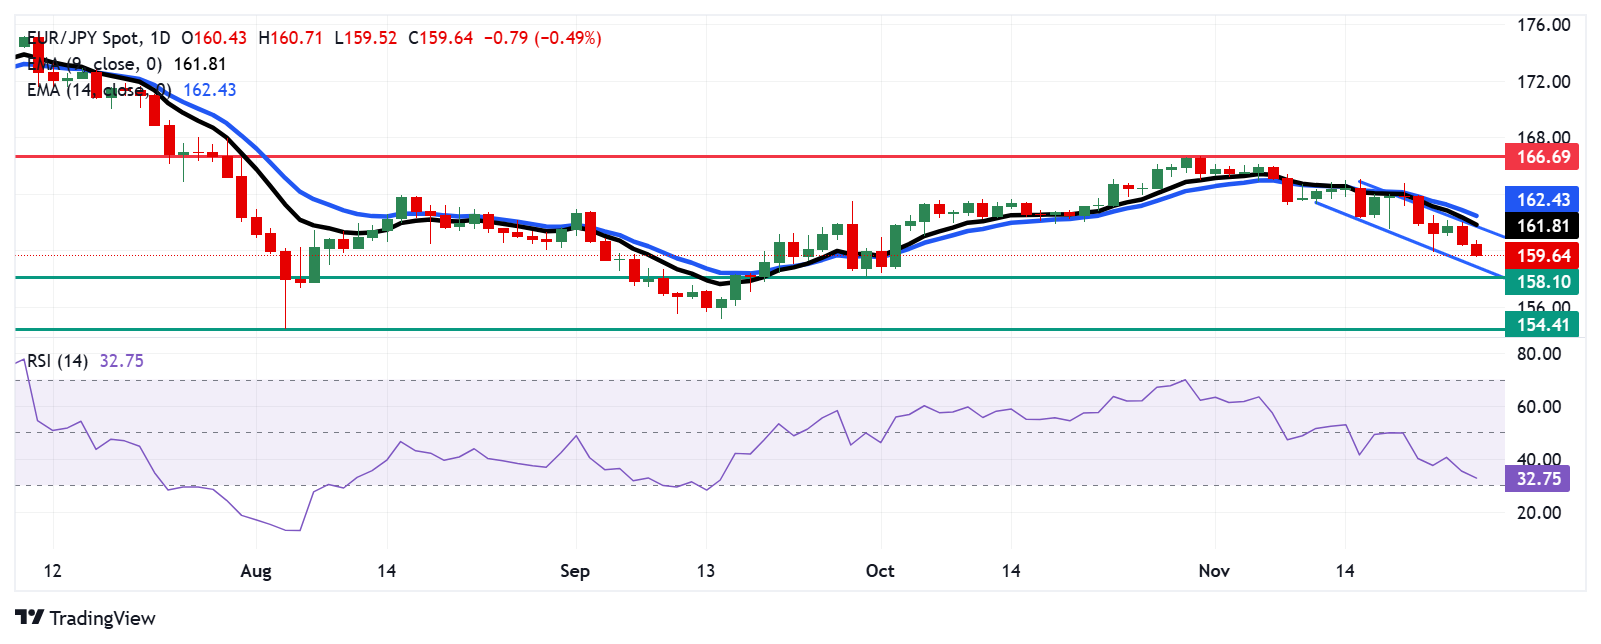
To the upside, the EUR/JPY cross could come close to testing the upper boundary of the descending channel near the nine-day exponential moving average (EMA) at the 161.80 level, followed by the 14-day EMA at 162.43. A decisive break above these levels would cause a shift in momentum from bearish to bullish to emerge and support the pair to retest a four-month high of 166.69, a level last seen on October 31.
EUR/JPY: Daily Chart
Euro PRICE Today
The table below shows the percentage change of the Euro (EUR) against the main currencies today. Euro was the weakest currency against the New Zealand Dollar.
| USD | EUR | GBP | JPY | CAD | AUD | NZD | CHF | |
|---|---|---|---|---|---|---|---|---|
| USD | 0.02% | -0.10% | -0.46% | 0.05% | -0.21% | -0.61% | -0.14% | |
| EUR | -0.02% | -0.13% | -0.46% | 0.02% | -0.24% | -0.64% | -0.14% | |
| GBP | 0.10% | 0.13% | -0.36% | 0.15% | -0.11% | -0.50% | -0.04% | |
| JPY | 0.46% | 0.46% | 0.36% | 0.49% | 0.23% | -0.17% | 0.31% | |
| CAD | -0.05% | -0.02% | -0.15% | -0.49% | -0.26% | -0.68% | -0.18% | |
| AUD | 0.21% | 0.24% | 0.11% | -0.23% | 0.26% | -0.40% | 0.09% | |
| NZD | 0.61% | 0.64% | 0.50% | 0.17% | 0.68% | 0.40% | 0.47% | |
| CHF | 0.14% | 0.14% | 0.04% | -0.31% | 0.18% | -0.09% | -0.47% |
The heat map shows percentage changes for major currencies. The base currency is selected from the left column, while the quote currency is selected from the top row. For example, if you choose the Euro from the left column and move along the horizontal line to the US Dollar, the percentage change shown in the box will represent EUR (base)/USD (quote).
Source: Fx Street
I am Joshua Winder, a senior-level journalist and editor at World Stock Market. I specialize in covering news related to the stock market and economic trends. With more than 8 years of experience in this field, I have become an expert in financial reporting.


