
- EUR/JPY rises to 161.79 after breaking above the 50-day moving average (DMA), marking its third consecutive day of gains.
- Momentum shows signs of consolidation ahead, with resistance at 162.45/65 and the 200-day moving average (DMA) at 164.10.
- A break below 160.74 could expose the pair to support at 158.99/98, near the Tenkan Sen level.
EUR/JPY posted solid gains of over 0.40% on Thursday, extending its rally to three consecutive days. The United States (US) data improved risk appetite and consequently weighed on the Japanese Yen due to its safe haven status. At the time of writing, the cross pair is trading at 161.79.
EUR/JPY Price Forecast: Technical Outlook
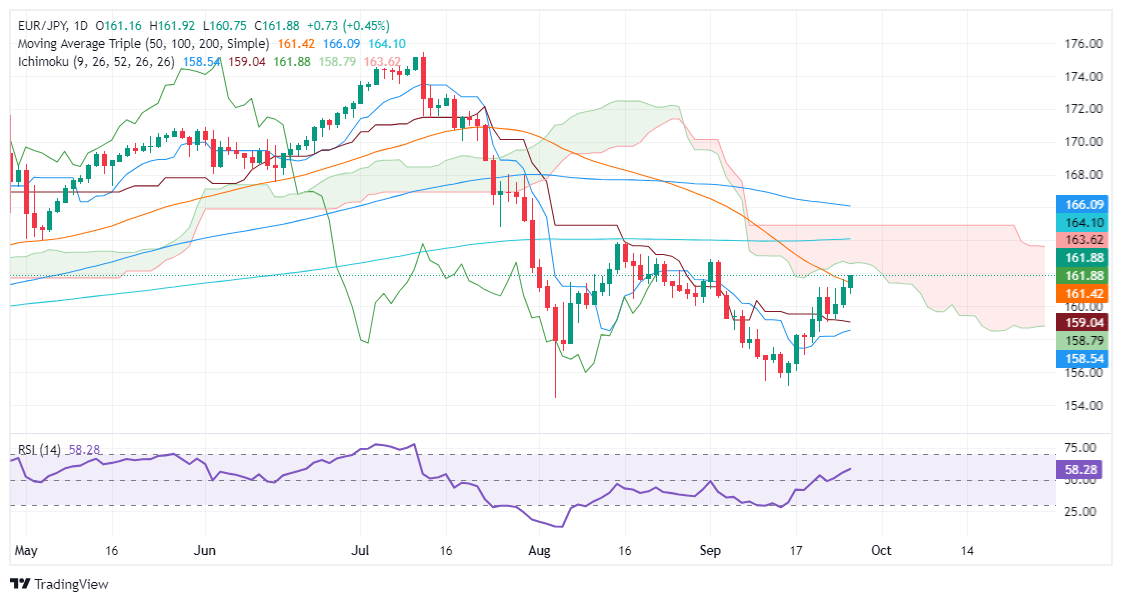
The EUR/JPY uptrend remains intact, although the pair pointed higher towards the bottom of the Ichimoku (Kumo) cloud after breaking above the 50-day moving average (DMA) at 161.19.
The momentum suggests that buyers are losing some strength, as shown by the slope of the Relative Strength Index (RSI) turning flat, meaning consolidation is ahead.
If EUR/JPY breaks below the Kumo bottom around 162.45/65, the next resistance level would be the Senkou Span B at 163.13, followed by the 200-day moving average (DMA) at 164.10 .
Conversely, if EUR/JPY falls below the September 26 low of 160.74, the next support would be the confluence of the September 24 daily low and the Tenkan Sen around 158.99/98.
EUR/JPY Price Action – Daily Chart
Euro PRICE Today
The table below shows the percentage change of the Euro (EUR) against the main currencies today. Euro was the strongest currency against the Australian Dollar.
| USD | EUR | GBP | JPY | CAD | AUD | NZD | CHF | |
|---|---|---|---|---|---|---|---|---|
| USD | 0.00% | 0.00% | 0.01% | 0.01% | 0.03% | -0.00% | -0.04% | |
| EUR | -0.00% | -0.01% | 0.00% | -0.03% | 0.03% | -0.02% | -0.04% | |
| GBP | -0.00% | 0.01% | 0.02% | -0.01% | 0.04% | 0.00% | -0.03% | |
| JPY | -0.01% | 0.00% | -0.02% | -0.01% | 0.04% | -0.01% | -0.01% | |
| CAD | -0.01% | 0.03% | 0.00% | 0.00% | 0.00% | 0.00% | -0.04% | |
| AUD | -0.03% | -0.03% | -0.04% | -0.04% | -0.01% | -0.02% | -0.05% | |
| NZD | 0.00% | 0.02% | -0.01% | 0.01% | -0.00% | 0.02% | -0.04% | |
| CHF | 0.04% | 0.04% | 0.03% | 0.01% | 0.04% | 0.05% | 0.04% |
The heat map shows percentage changes for major currencies. The base currency is selected from the left column, while the quote currency is selected from the top row. For example, if you choose the Euro from the left column and move along the horizontal line to the US Dollar, the percentage change shown in the box will represent EUR (base)/USD (quote).
Source: Fx Street
I am Joshua Winder, a senior-level journalist and editor at World Stock Market. I specialize in covering news related to the stock market and economic trends. With more than 8 years of experience in this field, I have become an expert in financial reporting.


