
- EUR/JPY is correcting lower after another test of the top of its ten-week range.
- The pair could start to fall within the range if it passes several confirmation levels.
EUR/JPY pulls back after testing the top of its ten-week range. The pair is in a sideways trend with probabilities favoring a continuation in line with the trend theory of technical analysis.
EUR/JPY 4-hour chart
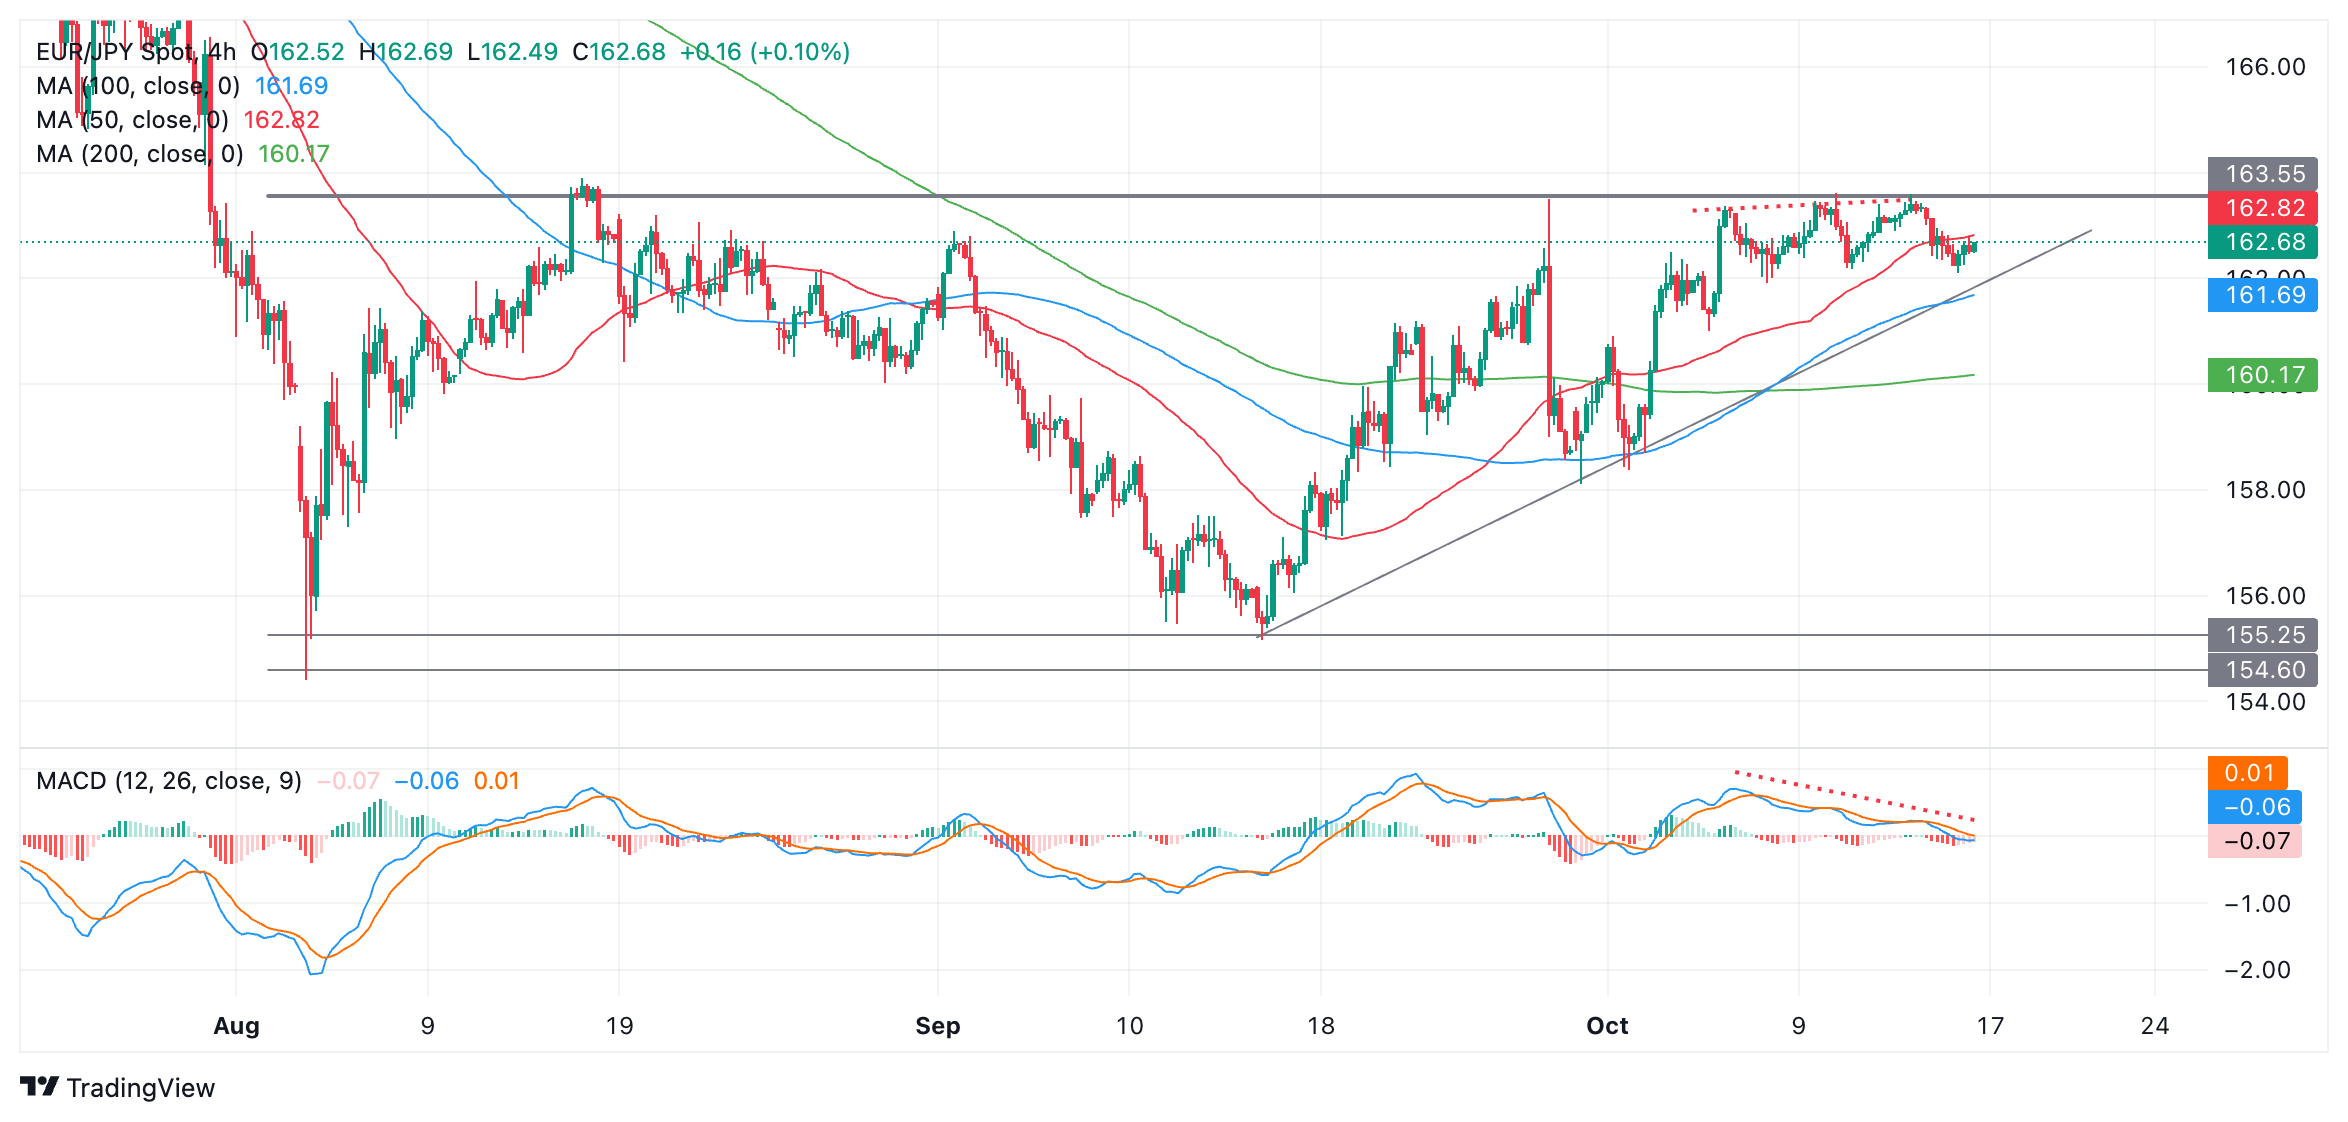
The next movement of EUR/JPY will probably be downwards, therefore, towards the bottom of the range in the 154 area.
A break below 161.91 (October 8 low) would help confirm such a move, and a break of the trend line for the bullish leg around 161.80 (black line on chart) would provide stronger confirmation. The next bearish target is around 158.32 – the lows of October 1 and September 30.
The Moving Average Convergence/Divergence (MACD) momentum indicator is bearishly diverging with the price (dotted red lines on the chart). While the price has been making slightly higher highs with each breakout attempt, the MACD has been declining. This is an additional warning sign of losses to come.
Alternatively, it is possible that EUR/JPY breaks above the range. Such a break would need to be decisive to inspire confidence. A decisive move would be one characterized by a longer-than-usual green candle clearing the top of the range and closing near its high, or three green candles in a row breaking above the top of the range.
Source: Fx Street
I am Joshua Winder, a senior-level journalist and editor at World Stock Market. I specialize in covering news related to the stock market and economic trends. With more than 8 years of experience in this field, I have become an expert in financial reporting.


