
- Euro fails at 147.80 and pulls back below 147.00.
- The market mood is more sour, which favors a slight recovery in the JPY.
- EUR/JPY is trapped in a bullish triangle pattern.
The euro capped at 147.80 and retreated against the Japanese yen on Monday, retracing Friday’s gains to hit session lows at 146.70. The sourer mood in markets at the start of the week has underpinned the safe haven Japanese yen, weighing on the common currency.
Yen appreciates on risk aversion
Earlier in the day, figures for manufacturing and services activity in China reactivated investor fears that the impact of strict COVID-19 restrictions on the world’s second-largest economy could slow global growth. , which has affected risk appetite.
Furthermore, the market remains cautious ahead of the US Federal Reserve’s monetary policy meeting scheduled for Wednesday, which has weighed on the euro against a stronger dollar.
At the macroeconomic level, preliminary data showed that eurozone inflation accelerated above expectations in October, showing an annual rise of 10.7%, compared to the 1.2% expected by the market, and after an increase of 9.9% in The last month.
These figures, combined with the slowdown in Gross Domestic Product; 0.2% in the third quarter compared to 0.8% in the previous quarter, are posing a problem for the ECB and have increased the downward pressure on the euro.
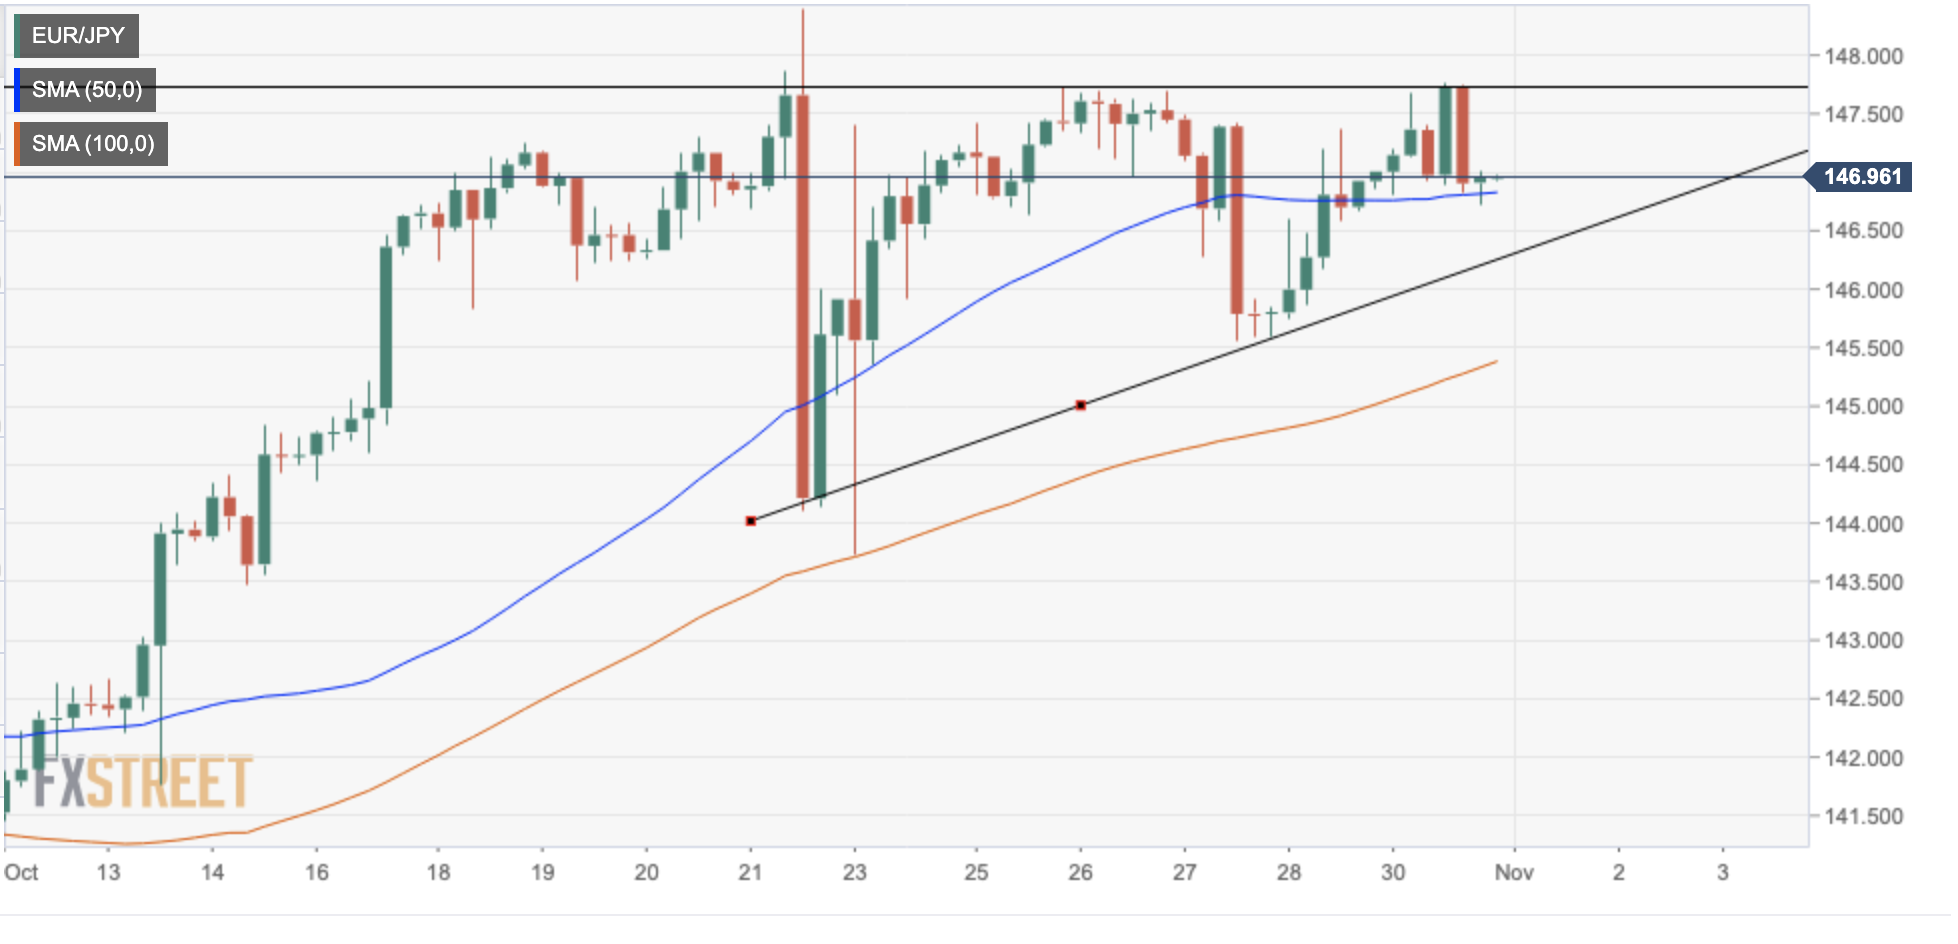
EUR/JPY is stuck in a bullish triangle pattern
From a technical perspective, the 4-hour chart shows the pair pulling back from the top of a bullish triangle pattern (pictured below).
The pair’s reversal from the aforementioned 147.80 area appears to have found buyers at the 50-period SMA, now around 146.80, closing the way to the lower bound of the triangle at 146.20.
To the upside, a successful move above 147.80 would add to the upside traction, which could push the pair towards the 17th Oct high at 148.40 ahead of the psychological level of 150.00.
EUR/JPY 4-hour chart
Technical levels to watch
Source: Fx Street
With 6 years of experience, I bring to the table captivating and informative writing in the world news category. My expertise covers a range of industries, including tourism, technology, forex and stocks. From brief social media posts to in-depth articles, I am dedicated to creating compelling content for various platforms.


