
- EUR/MXN appears to be breaking the top of a Bullish Flag price pattern.
- These patterns signal the likelihood of further upside developing.
EUR/MXN is in a medium to long-term uptrend within which it appears to have completed a Bull Flag continuation pattern. These patterns are bullish and are composed of a strong rally, known as the “flagpole”, followed by a rectangular or square consolidation phase, called the “flagpole”.
EUR/MXN daily chart
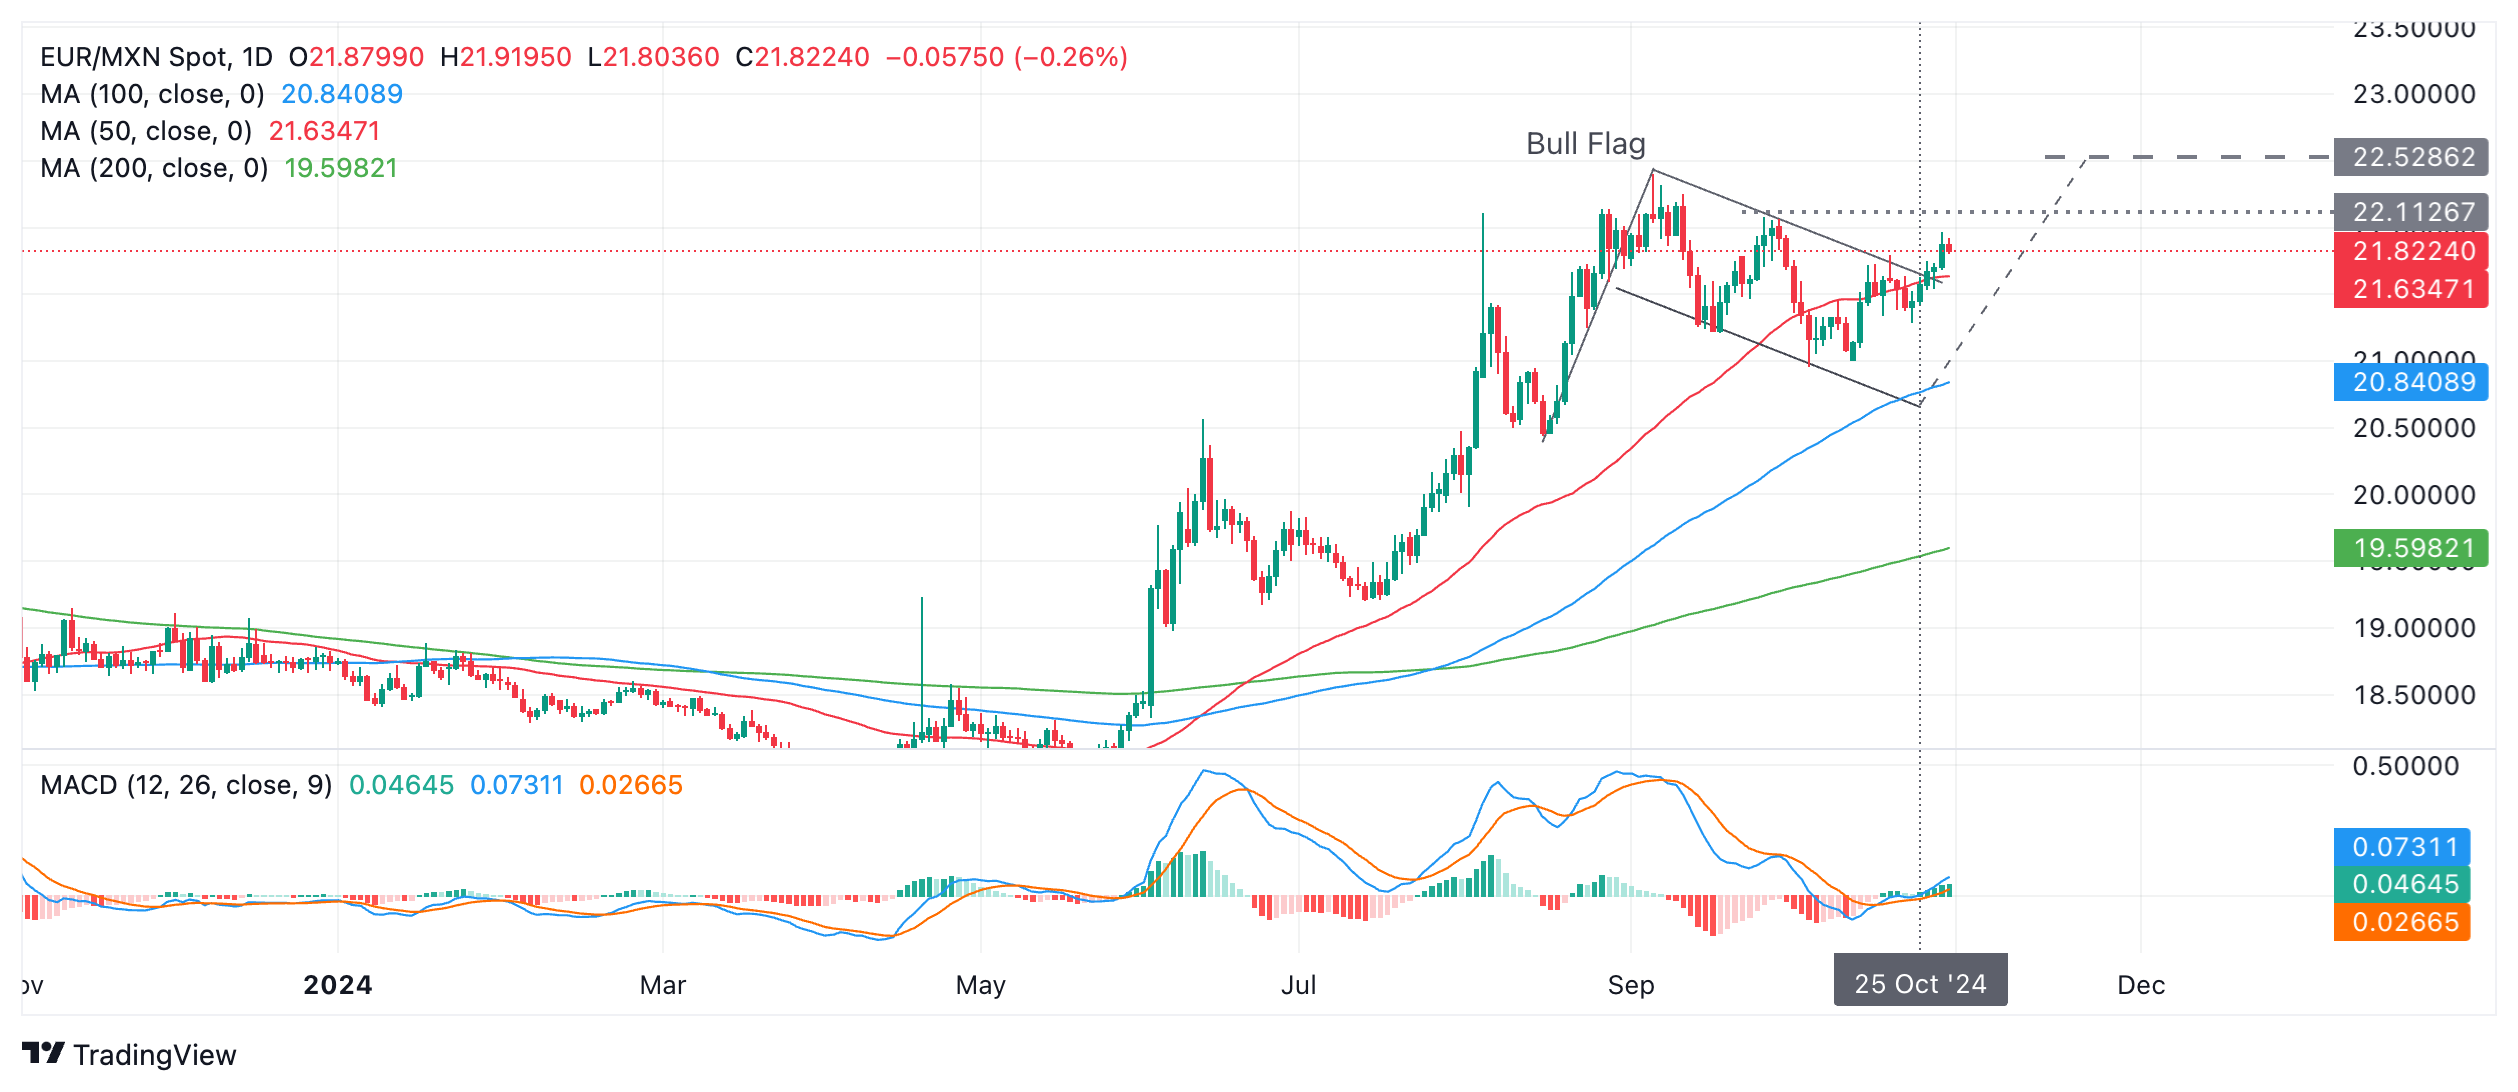
In the case of EUR/MXN, the flagpole probably began on August 15, leading to a rally to a peak on September 5 before the price fell and began to form the flag box section. This now looks complete and the price is in the process of breaking the top of the flag, a sign that it is about to start rallying again.
A break above the September 26 high of 22.07 would provide confirmation for the pattern and would likely lead to a continuation to a preliminary target at 22.40, the September 5 peak followed by 22.52 (dashed gray line in the chart), the actual target calculated using the pattern. The target is calculated by extrapolating the length of the flagpole upwards, in the usual method of forecasting these patterns.
Source: Fx Street
I am Joshua Winder, a senior-level journalist and editor at World Stock Market. I specialize in covering news related to the stock market and economic trends. With more than 8 years of experience in this field, I have become an expert in financial reporting.


")
