
- EUR/USD bears are watching the price action and are on the hunt for opposing structures to align with.
- A break above 78.6% may deter bears from getting too involved, but the 1.0470 zone is in the spotlight.
- Countdown to Nonfarm Payrolls and US CPI.
The pair EUR/USD It is picking up ground on Thursday and has rallied from a low of 1.0536 to a corrective high of 1.0586 so far in the American session, ahead of Friday’s US Non-Farm Payrolls. US stocks were held back by concerns about rising long-term interest rates, but Treasury yields have fallen on Wall Street, supporting risk appetite.
US economic data has shown signs of cracks in a tense US job market, contrasting with markets’ positioning following Federal Reserve Chairman Jerome Powell’s hawkish rhetoric to Congress At the beginning of the week.
Data released on Thursday took the sting out of Fed Chairman Jerome Powell’s hawkish tone and showed US jobless claims jumped 11% last week. This is the largest increase in five months. At the same time, planned layoffs for February quadrupled year-on-year. These data could indicate that the Fed’s rate hike cycle has unfolded as expected and negates the need for aggressive rate hikes.
Consequently, all three major US stock indices rose and the dollar is down in a correction from a three-month high near 105.90 recorded earlier in the week. US Treasury yields have fallen 0.8% and hit a low of 3.94% from 4.019%. For its part, the euro has risen. However, Friday’s Non-Farm Payrolls and next week’s Consumer Price Index will be instrumental in guiding market expectations regarding the policy guidance the FOMC is likely to offer at the March meeting.
Heading into tomorrow’s event, the previous ADP report pointed to another strong jobs report. It is worth noting that NFP has outperformed ADP for seven consecutive months. Will this streak continue in February? ADP’s headline reading was 242,000, up from 200,000 expected and 119,000 revised (which was 106,000) in January. “The data reinforces the feeling that the economy is still functioning in February,” explained analysts at Brown Brothers Harriman.
Of course, you have to remember that ADP missed a lot in January, even after the review, so its predictive power leaves a lot to be desired.” That being said, the consensus for Friday’s NFPs is up to 225,000 from 517,000 in January. The unemployment rate remains at 3.4% and average hourly earnings rebound to 4.5%. Obviously, the big unknown is whether the NFP figures for January will be revised significantly in either direction,” the analysts explained. As for their outlook for EURUSD, they said they believe it remains on track to test the 2023 low near $1.0485.
For his part, Chris Turner, an analyst at ING, said in a webinar that “the euro could have a difficult time recovering until the third quarter, when the dollar is likely to fall along with the short end of the yield curve. of the US Treasury.
“Our baseline view for the second quarter had been a 1.05-1.10 range and we are clearly more towards the lower end of that range and I suspect that the 1.05 area is going to be more pressured and more vulnerable during that period.” says Turner, adding:
”However, the European Central Bank has been quite tough on the prospect of further interest rate hikes, which may prevent EUR/USD from falling below the 1.05 support level, even as the Federal Reserve from the US give signs of raising interest rates”.
EUR/USD daily chart
In previous analysis, an M was shown to be forming on the daily chart as follows:
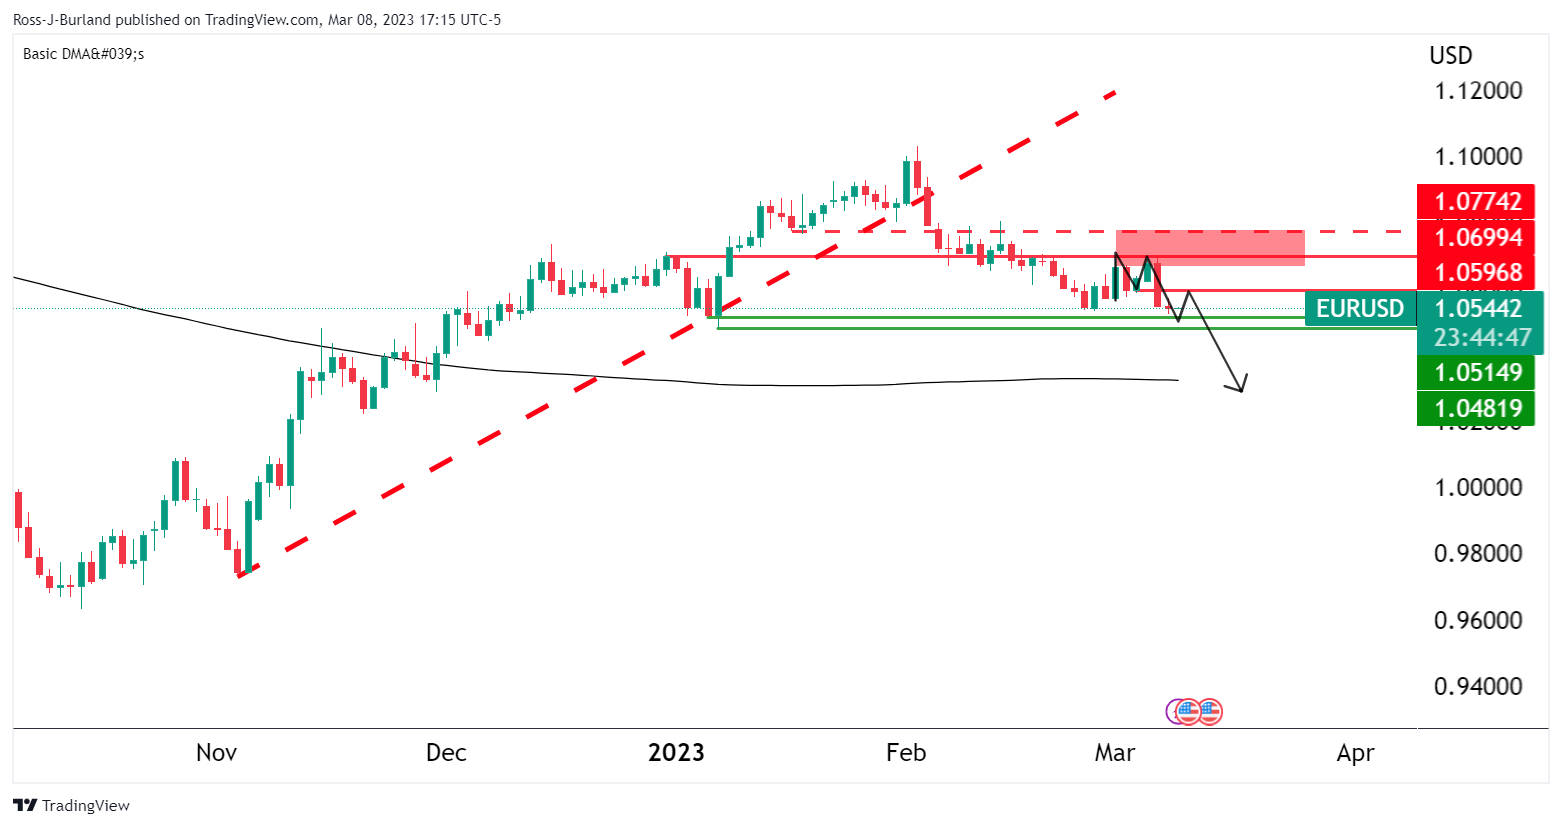
”Price has carved out an M formation which is a pattern that tends to see a retest of the neckline near a 50% mean reversal in this particular case. 1.0520 guards 1.0480 while bulls will have to break above 1.06 to open risk at 1.0700.”
EUR/USD Update
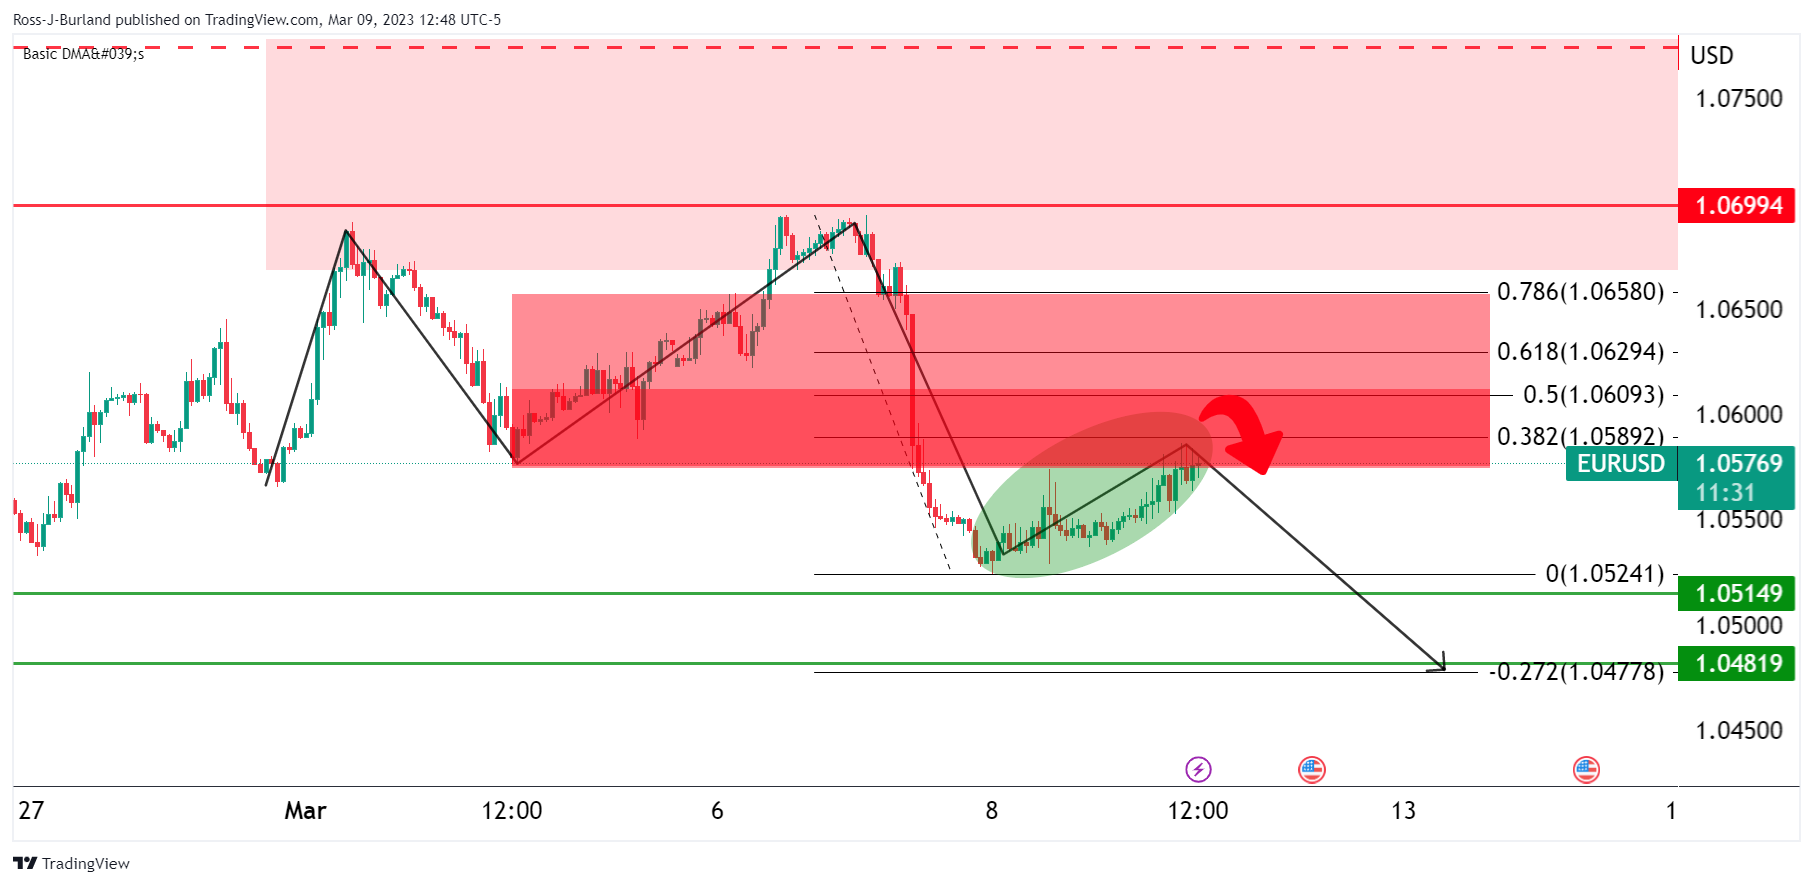
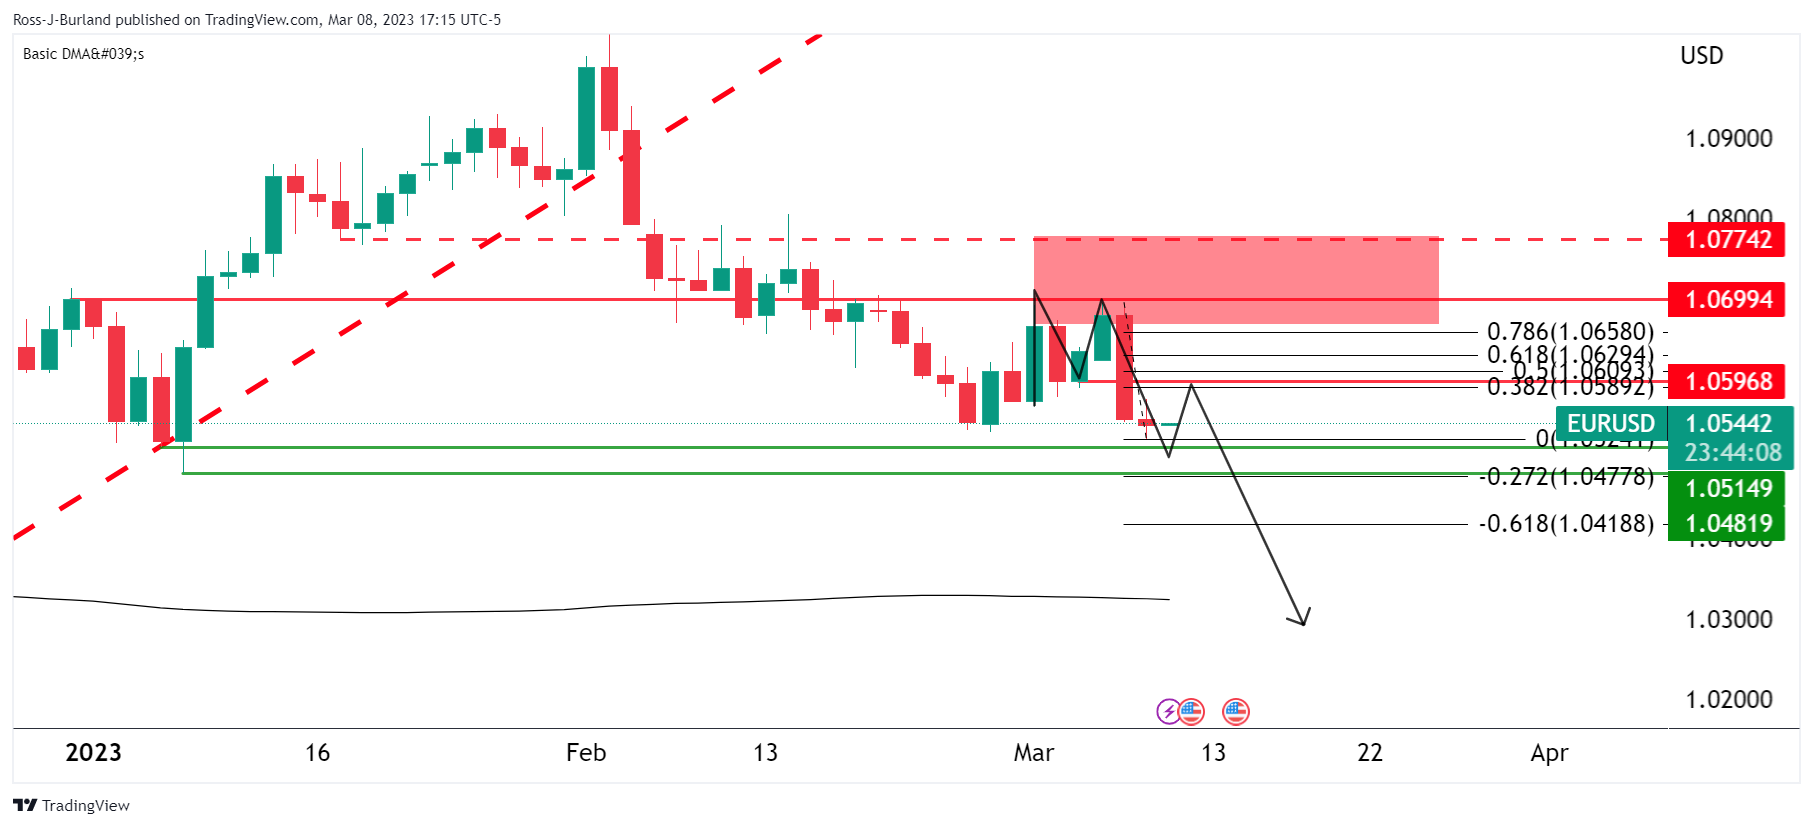
On the hourly chart, we can see how the M formation has played out, with price moving towards the resistance at the neckline area, approaching the 38.2% Fibonacci retracement level.
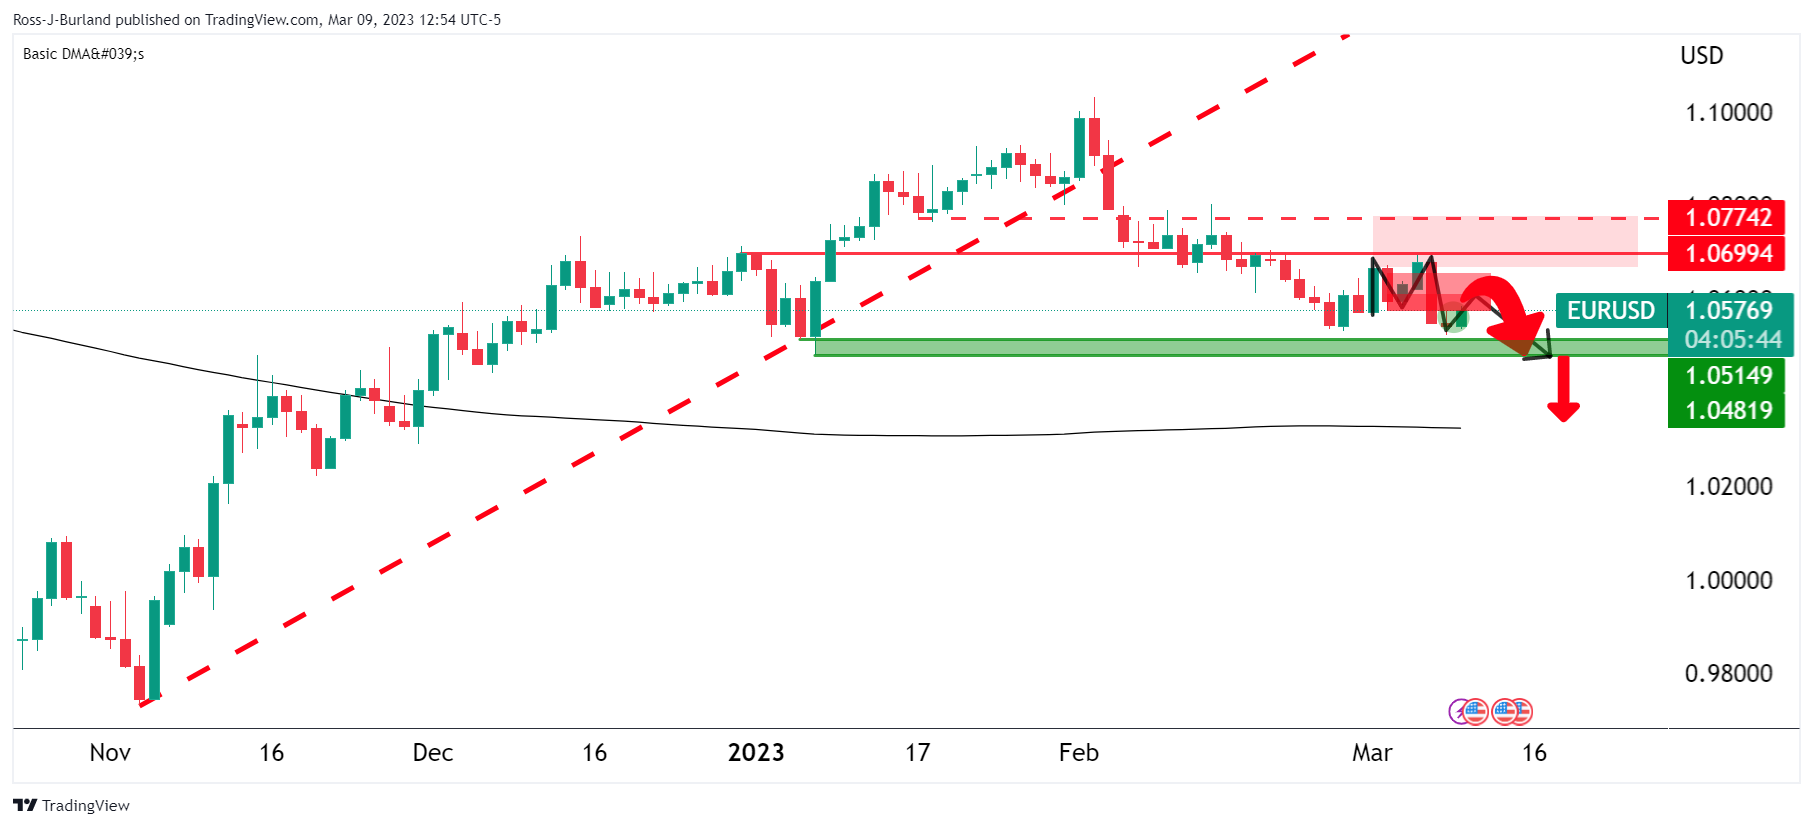
At this juncture, the bears will be monitoring price action and looking for opposite structures to align their short positions. A break above the 78.6% Fibonacci level may deter bears from getting heavily involved, but the 1.0475 zone is seen as a bearish target for a test of critical support on the way to the 200 DMA according to the daily chart:
Source: Fx Street
I am Joshua Winder, a senior-level journalist and editor at World Stock Market. I specialize in covering news related to the stock market and economic trends. With more than 8 years of experience in this field, I have become an expert in financial reporting.


