
- The EUR/USD pair reverses previous losses and trades at 1.0858, up 0.21%, as recession fears loom on both sides of the Atlantic.
- The PMI S&P Global indices show a contraction in business activity in the US and the EU, fueling speculation that central banks may pause in tightening monetary policy.
- US 10-year Treasury yields fall 12 basis points to 4,208%, weakening the dollar; Investors are watching Powell’s next speech for clues about his monetary policy.
The Euro (EUR) reverses course and pares earlier losses that dragged the exchange rate to a new two-month low of 1.0802 on weaker economic data from the Eurozone (EU), later followed by data from United States (USA). Recession fears have been revived on both sides of the Atlantic, although lately the EUR/USD was trading positive. At the time of writing, EUR/USD is trading at 1.0858, up 0.21%.
Wall Street rises on NVIDIA gains; weak economic data weighs on EUR and USD
Wall Street maintains its bullish trend as markets prepare for NVIDIA earnings reports. Conversely, poor economic reports on both sides of the Atlantic fueled speculation that the US Federal Reserve (Fed) and the European Central Bank (ECB) would pause their tightening cycle.
During the US session, S&P Global revealed that the Manufacturing PMI plunged further into contractionary territory, standing at 47 from 49 in July and well below forecasts for improvement to 49.3. The services component fell to 51.0 from 52.3 in July and missed expectations of 52.0. Consequently, the S&P Global Composite PMI, which includes both readings, was in expansionary territory at 50.4, below market expectations and the July reading of 52.0,
The data weighed on the US Dollar (USD), sending EUR/USD rising from the 1.0800 zone towards the 1.0830 zone, followed by a rally towards the 1.0860 zone, as US Treasury yields fell . US 10-year Treasury bonds fell 12 basis points to 4,208%, which is a drag on the dollar.
A basket of six currencies measured against the US dollar, the US Dollar Index (DXY), losing 0.17% to 103.421.
Other data showed a US government report revealed that US Nonfarm Payrolls through March would likely be revised down at 306,000, lower than analyst estimates of 500,000. Most recently, US new home sales for July came in at 4.4%m/m, up from the previous month’s -2.8%.
On the other hand, business activity in the EU entered contractionary territory, with all readings below estimates, except for manufacturing activity. Germany revealed the exact figures, with services and the composite sector deteriorating further, while manufacturing rose. Against this background, the ECB could refrain from raising rates at the September meeting, as the entire bloc economy suffers from high interest rates and the central bank struggles to rein in inflation.
Next, the US economic calendar will see Durable Goods Orders, the Chicago Fed National Activity Index and Initial Jobless Claims. US Federal Reserve Chairman Jerome Powell’s speech on Friday is highly anticipated by investors, who are looking for clues on the next monetary policy.
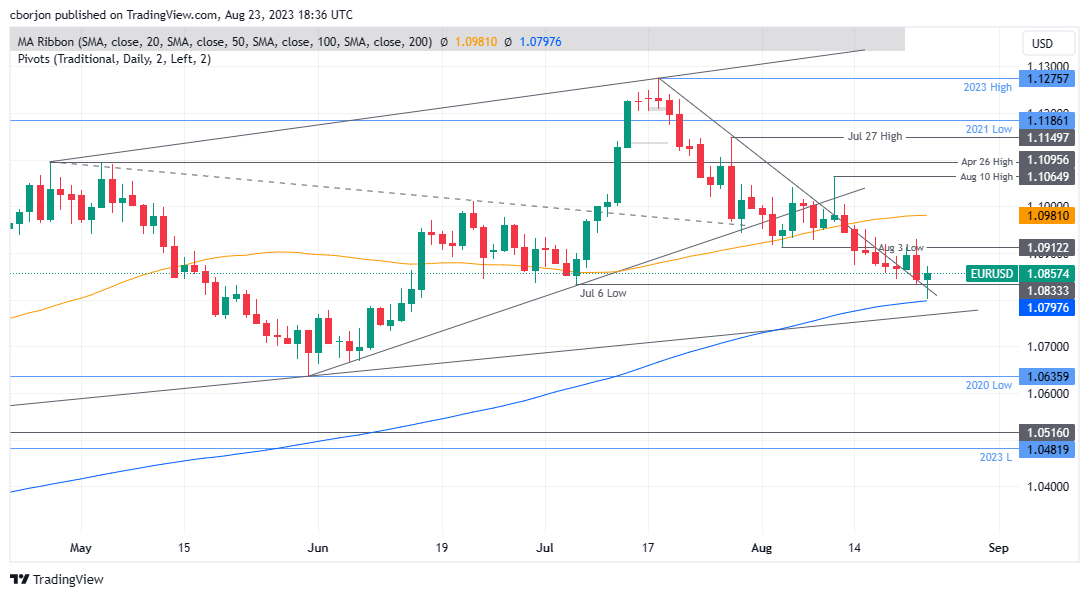
EUR/USD Price Analysis: Technical Perspective
The daily chart of the EUR/USD pair shows a neutral bias to the downside, despite failing to break above the 200-day moving average (DMA) at 1.0797. However, a daily close above the weekly open at 1.0866 is needed, so the EUR/USD pair could threaten the psychological level of 1.0900. In that case, the first resistance would be the August 23 high at 1.0871, followed by 1.0900. Otherwise, the EUR/USD pair could challenge 1.0800, followed by the 200 DMA.
EUR/USD Price Action – Daily Chart
Source: Fx Street
I am Joshua Winder, a senior-level journalist and editor at World Stock Market. I specialize in covering news related to the stock market and economic trends. With more than 8 years of experience in this field, I have become an expert in financial reporting.


