
- The EUR/USD pair gained more than 1% on Friday, approaching 1.0730.
- The Dollar, measured by the DXY Index, will close with a weekly loss of 1.40%.
- The Fed’s dovish stance and weak October NFP pushed the USD lower.
In Friday’s session, the pair EUR/USD it soared as high as 1.0730, closing with a 1.50% weekly gain, its best result since mid-June.
Among the daily movements of the pair, it is worth highlighting the general weakness of the Dollar, due to the fact that the Federal Reserve (Fed) changed its tone on Wednesday towards a more moderate stance and hinted that it is approaching the end of its monetary tightening cycle. In reaction, US Treasury yields fell to their lowest level since September, with the 2.5-year and 10-year yields falling to 4.84, 4.50 and 4.57%, adding more selling pressure on the USD.
It was reported on Friday that the US economy added fewer jobs than expected in October, while the unemployment rate rose to 3.9% and average hourly earnings rose less than expected. With the labor market showing signs of cooling, it fueled additional dovish bets on the Fed and, according to CME’s FedWatch tool, the odds of a 25 basis point hike in December dropped to nearly 9%, exacerbating the dollar’s slide. .
The market’s attention will now focus on the next data, since, despite having changed its tone, the Fed left the door open for further tightening. Until December, the entity will receive two additional readings on inflation and an additional report on employment.
EUR/USD levels to watch
Evaluating the daily chart, a neutral to bullish outlook is seen for the near term, with the bulls gradually regaining their strength. The Relative Strength Index (RSI) is pointing higher into bearish territory, hinting at a possible change in momentum and bullish resurgence, while the Moving Average Convergence (MACD) histogram features larger green bars.
On the four-hour chart, the pair reached overbought conditions, indicating that a technical correction could occur in the short term.
Support levels: 1.0700, 1.0670, 1.0630.
Resistance levels: 1.0750, 1.0770, 1.0800.
EUR/USD Daily Chart
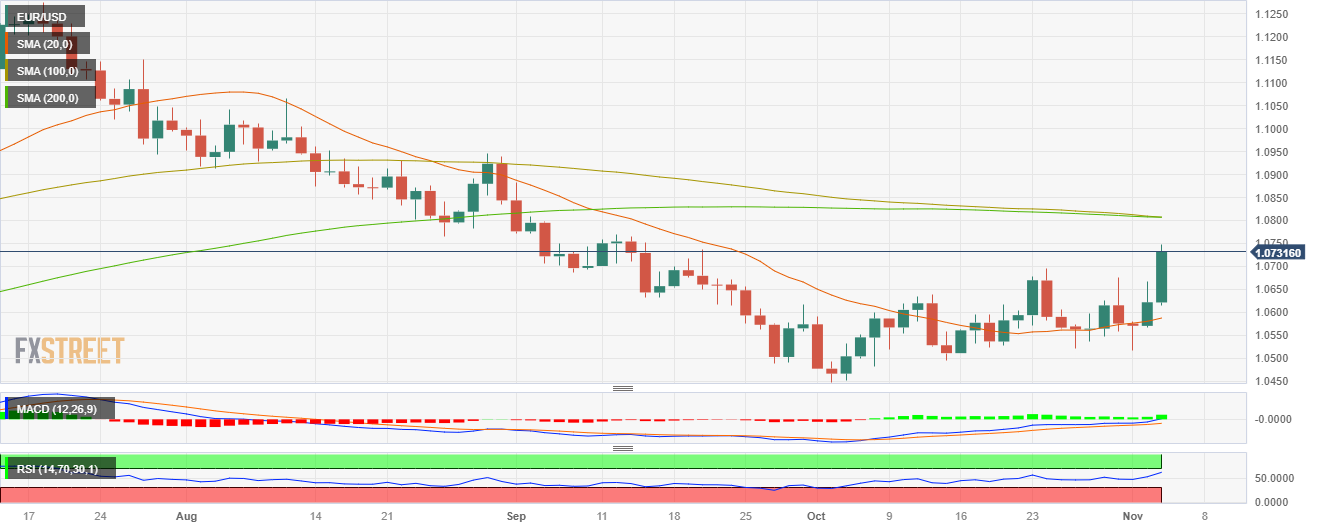
Source: Fx Street
I am Joshua Winder, a senior-level journalist and editor at World Stock Market. I specialize in covering news related to the stock market and economic trends. With more than 8 years of experience in this field, I have become an expert in financial reporting.


