
- EUR/USD continues to rise above 1.0700 despite more inflationary US GDP data.
- March Core Personal Expenditure Price Index Beats Estimates.
- EUR/USD strengthens after the report despite data suggesting a strengthening of the US Dollar.
The EUR/USD pair is trading around 1.0725 on Friday, little changed following the release of the March Personal Consumption Price Index (PCE), the US Federal Reserve's (Fed) preferred inflation indicator. .
In fact, the pair is trading slightly higher after the data from the PCE underlying data published by the US Bureau of Economic Analysis (BEA) will show a higher than expected reading of 2.8% annually, when analysts expected 2.6% compared to 2.8% previously. For the month, core PCE rose 0.3%, in line with expectations and the same as previous figures.
The data only marginally changes the probability that the Federal Reserve will cut interest rates in September, from 59% on the previous Friday to 60% later.
Other PCE data showed that the general price index for personal consumption expenditures rose to 2.7%, surpassing estimates of 2.6% and the previous reading of 2.5%. In month-on-month terms, the PCE rose 0.3%, as expected, and the same as the previous data.
Personal income rose 0.5%, as expected, and personal spending 0.8%, beating estimates of 0.6% and the same previous figure.
EUR/USD recovers after falling GDP data
The EUR/USD has recovered to 1.0735 after falling sharply to a low of 1.0678 on Thursday following the release of US Q1 GDP data. Although annualized GDP growth disappointed consensus expectations and fell below the previous quarter's growth rate, the price component of personal consumption expenditures, which measures changes in the prices of goods, was very strong. above compared to the previous quarter and supported the US Dollar (USD).
The inflationary data caused markets to reduce their expectations about when the Federal Reserve (Fed) will begin to cut interest rates, and the probability of a rate cut for the July meeting fell from 50% the day before to 34% afterwards. , according to Deutsche Bank analysts.
The expectation that interest rates will remain high for longer temporarily strengthened the dollar, but weighed on EUR/USD, as higher interest rates attract more foreign capital inflows.
Technical analysis: EUR/USD continues to slowly correct upwards
EUR/USD continues to correct higher despite experiencing a pullback below the 1.0700 level following the release of US GDP data on Thursday.
It has broken out of the rectangular range in which it was moving on the 4-hour chart after breaking through the top of the rectangle at 1.0700.
The bearish flag price pattern that developed between April 16 and April 22 appears deformed by the persistent price action above 1.0700 and is less credible.
EUR/USD 4-hour chart
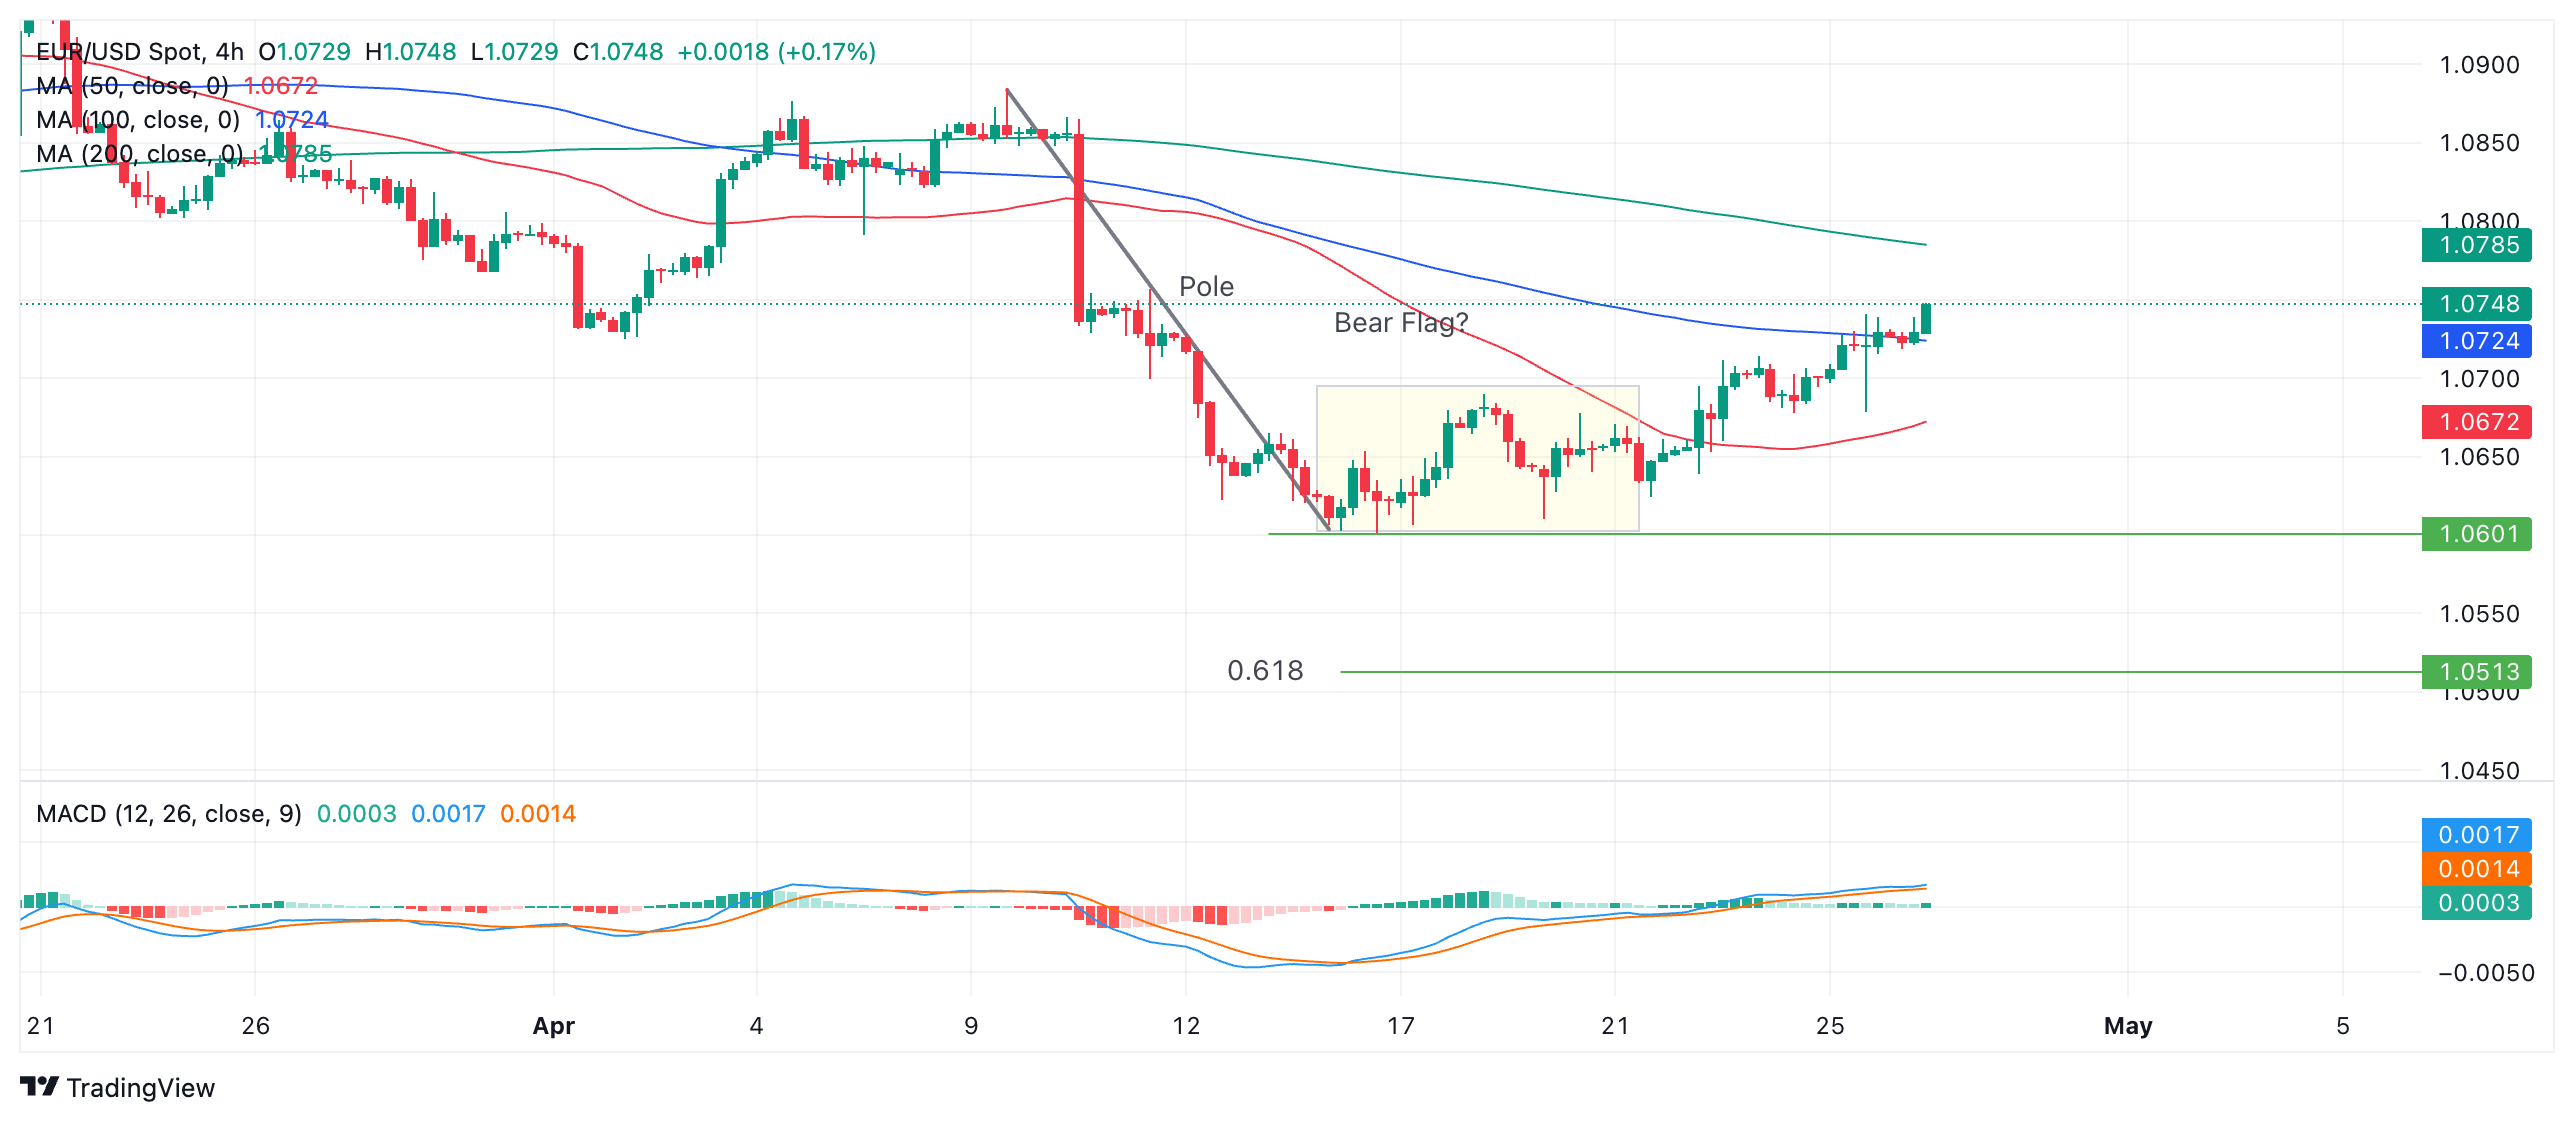
Establishing an ascending sequence of highs and lows on the 4-hour chart reinforces the argument that the short-term trend has turned bullish and therefore suggests further gains.
If it continues to rise, resistance from a lower previous high on April 11 gives an initial target at 1.0757. So, the 50-day and 200-day simple moving averages (SMA) on the daily chart (not shown) are likely to resist at 1.0807.
On the other hand, a break below the April 16 low of 1.0601 would revive the bearish pennant hypothesis.
According to technical tradition, the expected downward movement of a bearish flag is equal to the length of the “pole” or “suit” of the preceding flag or a Fibonacci ratio of the 'pole'.
The 0.618 Fibonacci ratio of the 'stick' extrapolated downwards gives a conservative target at 1.0503. The next concrete target is 1.0448, the October 2023 low. An equal length drop to the 'stick' would take EUR/USD to the 1.0403 level.
economic indicator
Expenditure on basic personal consumption – Price index (annual)
Core Personal Consumption Expenditure (PCE), published monthly by the US Bureau of Economic Analysis, measures changes in the prices of goods and services purchased by consumers in the United States (US). The PCE price index is also the preferred inflation indicator of the Federal Reserve (Fed). The annual reading compares the prices of goods in the reference month with the same month of the previous year. Generally, a high reading is bullish for the US Dollar (USD), while a low reading is bearish.
Following the publication of the GDP report, the US Bureau of Economic Analysis publishes data on the Personal Consumption Expenditure Price Index (PCE) along with monthly changes in Personal Expenditure and Personal Income. FOMC policymakers use the annual core PCE price index, which excludes volatile food and energy prices, as the main indicator of inflation. If the data were better than expected, the dollar could outperform its rivals as it would signal a possible shift in direction from the Fed towards hawkish monetary policy, and vice versa.
Source: Fx Street
I am Joshua Winder, a senior-level journalist and editor at World Stock Market. I specialize in covering news related to the stock market and economic trends. With more than 8 years of experience in this field, I have become an expert in financial reporting.


