
- The EUR/USD pair is trading down almost 0.50% following the publication of US Consumer Price Index data for the month of March.
- The pair is trading in a space between the 50, 100 and 200 day simple moving averages.
- Thursday's ECB meeting is likely to bring volatility to EUR/USD.
The EUR/USD pair is trading down almost half a percentage point, just above 1.0800, following the release of US Consumer Price Index (CPI) data on Wednesday.
The data showed higher-than-expected inflation in March and reduces the likelihood that the US Federal Reserve (Fed) will implement an early interest rate cut.
With interest rates expected to stay higher for longer, the US Dollar (USD) is getting a boost as higher interest rates attract greater foreign capital inflows.
However, the result is bearish for EUR/USD, as it measures the purchasing power of a single Euro in Dollar terms.
EUR/USD falls after US CPI data
EUR/USD is experiencing volatility following the release of US CPI data, which deviated significantly from expectations.
Data from the US Bureau of Labor Statistics showed that prices in the US rose 3.5% year-on-year in March, when a 3.4% rise had been estimated. This increase occurs after the annual increase of 3.2% registered in February.
Core CPI, which excludes food and energy price volatility, rose 3.8% annually, up from 3.7% expected and 3.8% previously.
Both inflation indicators rose 0.4% monthly in March, exceeding the estimate of 0.3%.
Inflation, higher than expected, keeps price pressures well above the Federal Reserve's (Fed) 2.0% target. This makes it even less likely that the Fed will lower interest rates from their current level of 5.5% in June, as had been anticipated.
In contrast to the Fed, the European Central Bank (ECB) is seen as more likely to cut interest rates sooner, amid more moderate growth and inflation expectations.
For EUR/USD, the maintenance of higher interest rates in the US compared to the Eurozone is a bearish factor. This is because relatively higher interest rates attract foreign capital inflows, favoring the US dollar in this case.
ECB meeting on the horizon
EUR/USD could see further volatility on Thursday after the European Central Bank (ECB) holds its April monetary policy meeting.
Some members of the ECB, such as the president of the Banque de France, François Villeroy de Galhau, have mentioned April as a possible time for the ECB to implement a first interest rate cut.
Most ECB members, however, believe that April is too early because the ECB will not yet have the latest wage data at hand, and wage inflation is considered a fundamental data point for its inflation models and decision-making process. decisions.
However, the EUR/USD pair could continue to move if the text of the accompanying statement suggests a higher probability of the ECB cutting interest rates in June.
Technical Analysis: EUR/USD seems increasingly trapped at the range boundary
EUR/USD appears trapped between the clamps of three significant simple moving averages (SMAs). On the short-term 4-hour chart it appears to be following a general sideways trend.
The 50-day and 200-day SMA offer support at 1.0830 and 1.0831, while the 100-day SMA acts as resistance at 1.0873.
EUR/USD Daily Chart
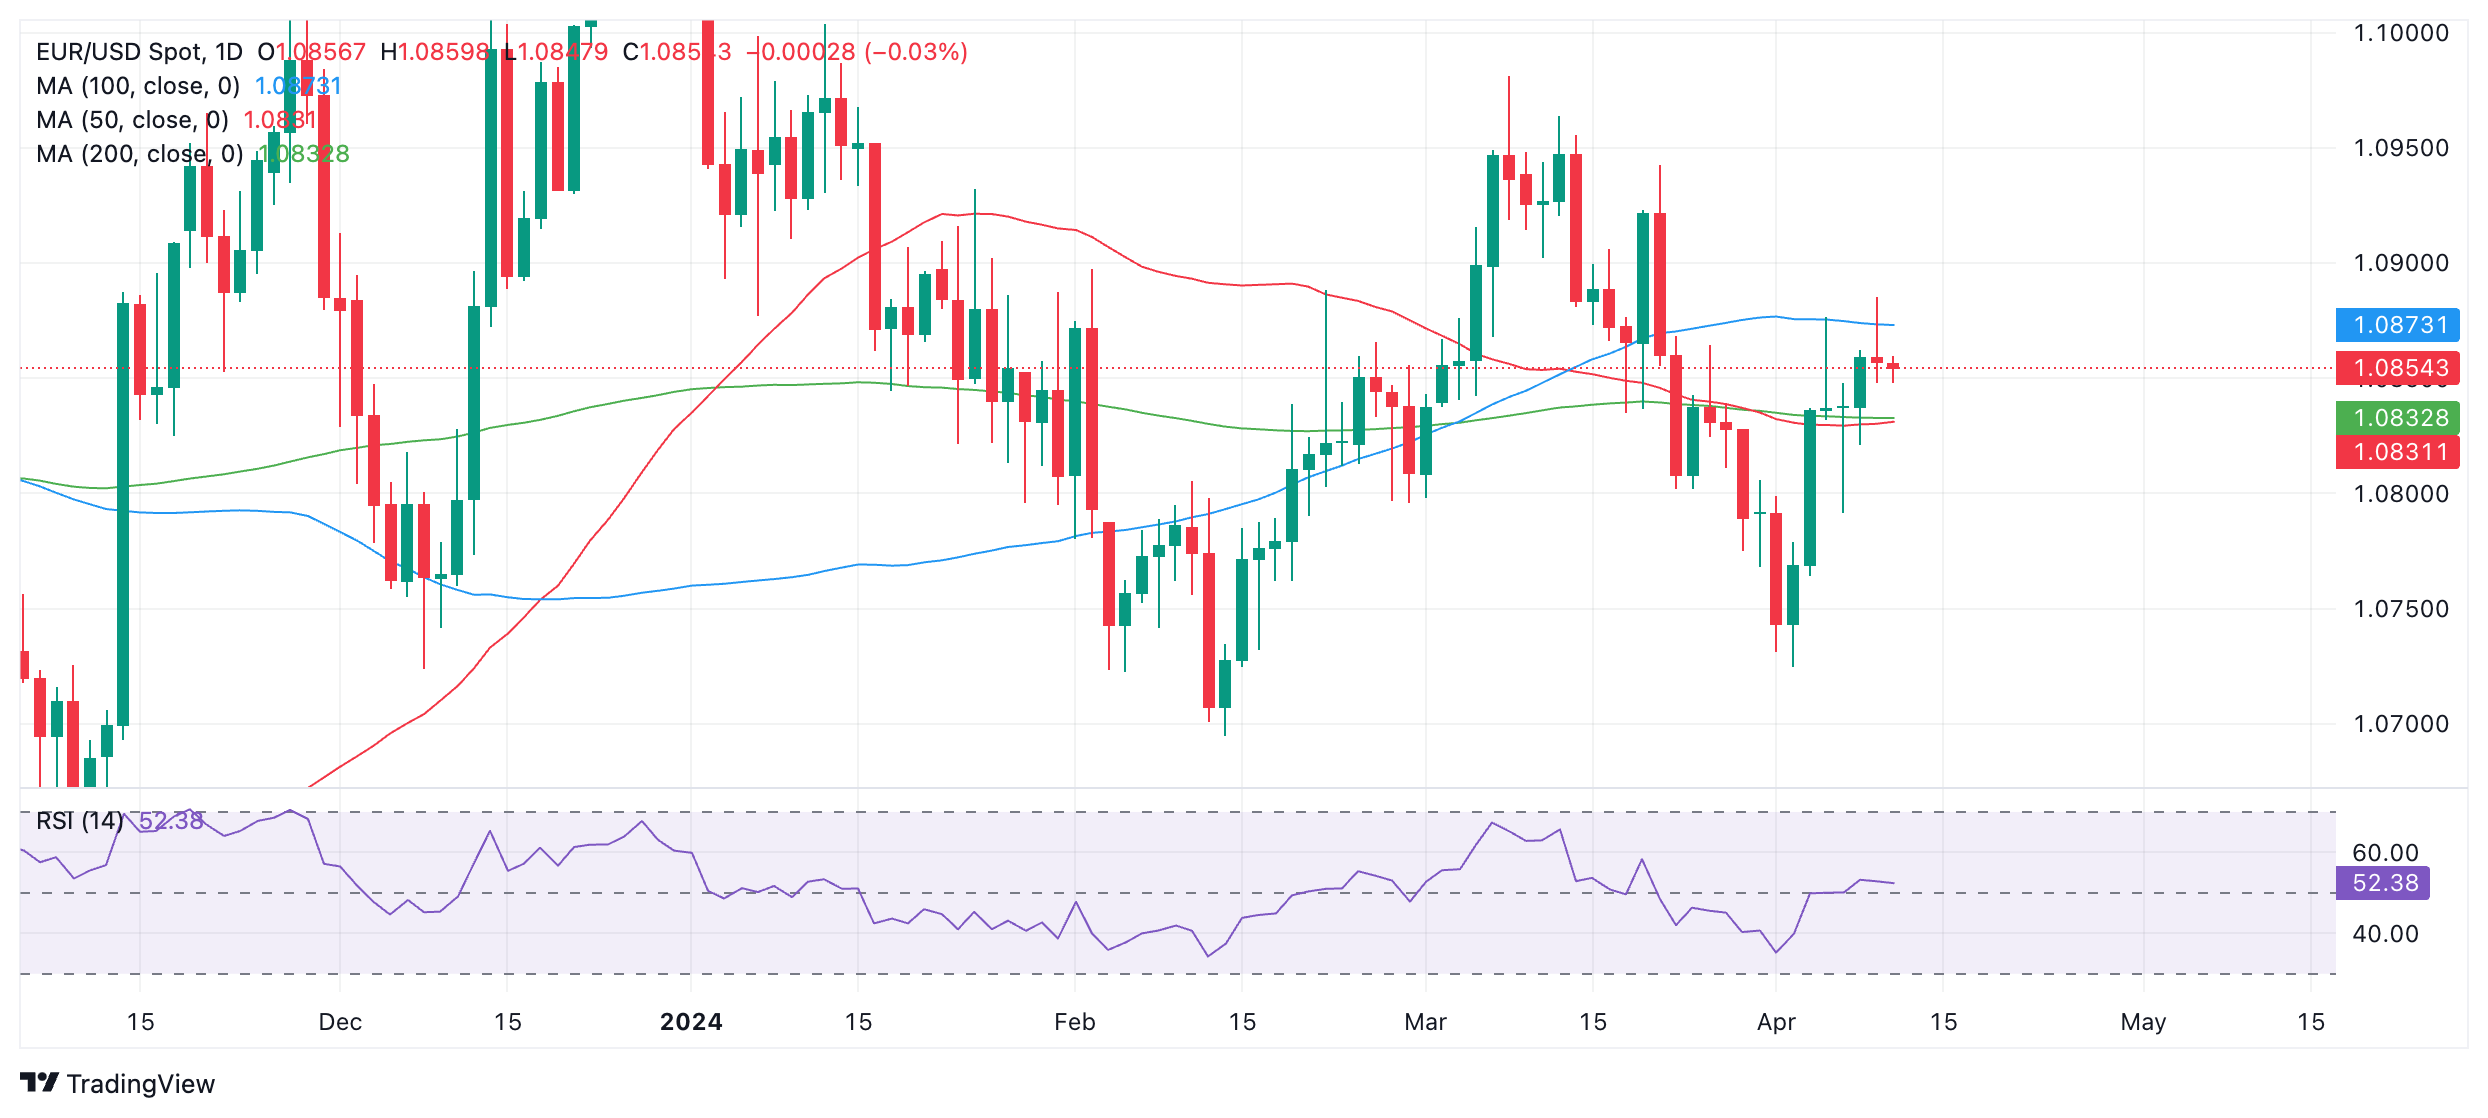
A decisive break above the 100-day SMA could lead to a rally to perhaps the March 21 high at 1.0942.
Alternatively, a decisive break below the cluster of MAs at 1.0835 could see a pullback evolve downwards to support at the April 2 lows at 1.0725.
A decisive break below would be characterized by a long red candle breaking through and closing near its low, or three red candles in a row breaking through the level.
The same would happen with a decisive break above, except with green candles instead of red.
economic indicator
Consumer Price Index (annual)
Inflationary or deflationary trends are measured by periodically adding the prices of a basket of representative goods and services and presenting the data as the Consumer Price Index (CPI). CPI data is collected monthly and published by the U.S. Bureau of Labor Statistics. The CPI is a key indicator for measuring inflation and changes in purchasing trends. Generally speaking, a high reading is considered bullish for the US Dollar (USD), while a low reading is considered bearish.
Source: Fx Street
I am Joshua Winder, a senior-level journalist and editor at World Stock Market. I specialize in covering news related to the stock market and economic trends. With more than 8 years of experience in this field, I have become an expert in financial reporting.


