
- EUR/USD fades recent advance and breaks below 0.9800.
- The October low near 0.9630 is the next point down.
The EUR/USD reverses rally to 0.9870/80 zone and looks under pressure below 0.9800 support on Wednesday.
The pair’s inability to break above weekly highs near 0.9880 in the very short term could attract additional selling pressure and pave the way for a likely test of the October low at 0.9631 (Oct 13).
In the longer term, the bearish view on the pair should remain unchanged as long as it is below the 200-day SMA at 1.0553.
EUR/USD daily chart
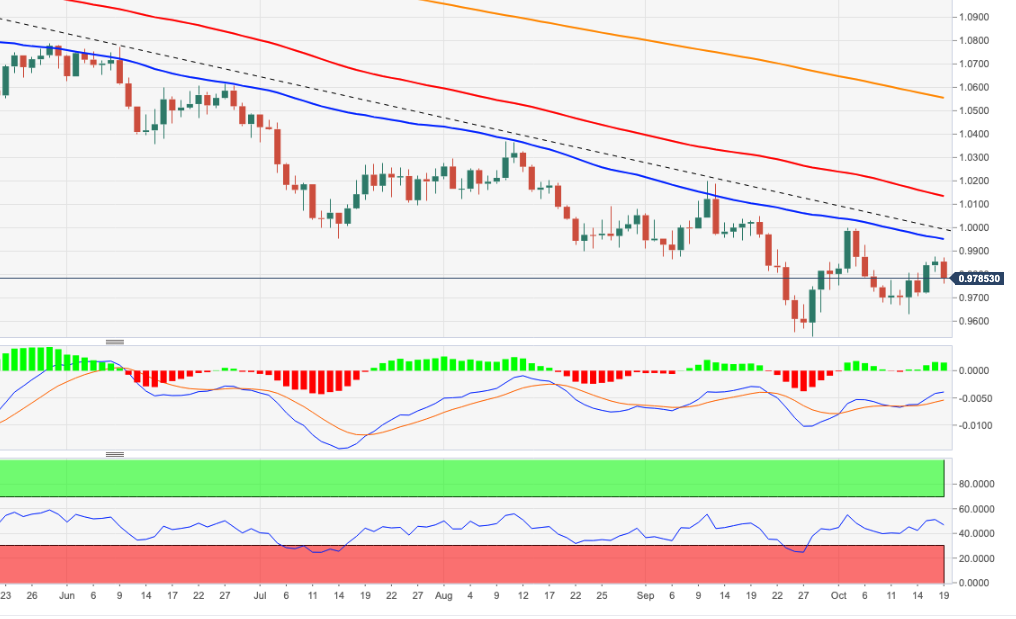
Source: Fx Street
With 6 years of experience, I bring to the table captivating and informative writing in the world news category. My expertise covers a range of industries, including tourism, technology, forex and stocks. From brief social media posts to in-depth articles, I am dedicated to creating compelling content for various platforms.


