
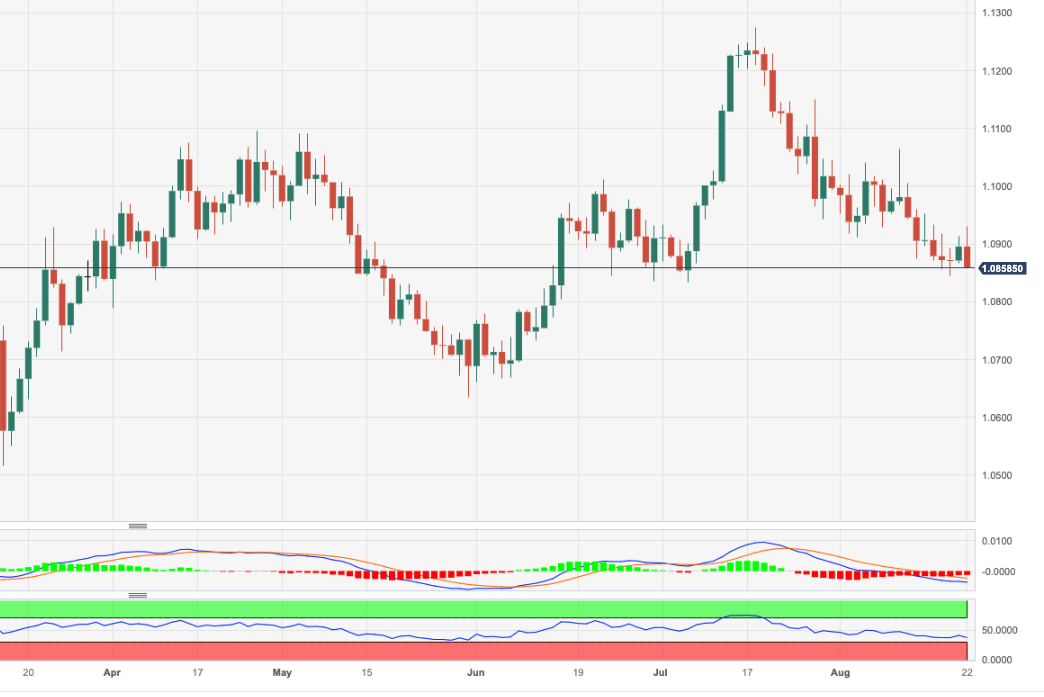
- EUR/USD retraces the initial rise to the 1.0930 zone.
- Next, on the downside, is the August low at 1.0844.
He EUR/USD resumes bearish path after rallying to the 1.0930 area early on Tuesday.
Further losses are expected to test the August low at 1.0844 (August 18) before the July low at 1.0833 (July 6). Furthermore, the loss of this region leaves the pair vulnerable to a probable test of the critical 200-day SMA at 1.0795 on the near-term horizon.
Meanwhile, the positive outlook for the pair remains as long as it stays above the 200-day SMA.
EUR/USD daily chart
Source: Fx Street
I am Joshua Winder, a senior-level journalist and editor at World Stock Market. I specialize in covering news related to the stock market and economic trends. With more than 8 years of experience in this field, I have become an expert in financial reporting.


