
- EUR/USD extends decline to 1.0050/45 band.
- The next thing to the downside looks like a potential test of the parity zone.
The EUR/USD adds to the recent weakness and extends the break of the 1.0100 level at the end of the week.
In the short-term horizon, new losses appear, as well as a probable visit to the parity level. Loss of this key support zone could expose a deeper pullback to the season low at 0.9952 (14 Jul).
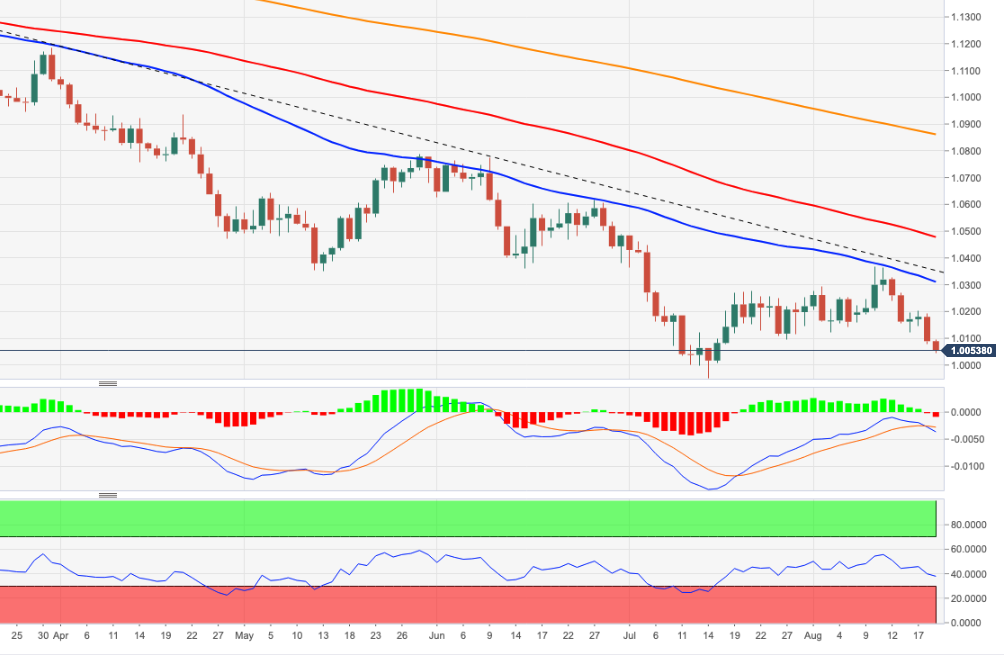
In the long term, the bearish view of the pair is expected to prevail as long as it trades below the 200-day SMA at 1.0859.
EUR/USD daily chart
Technical levels
Source: Fx Street
With 6 years of experience, I bring to the table captivating and informative writing in the world news category. My expertise covers a range of industries, including tourism, technology, forex and stocks. From brief social media posts to in-depth articles, I am dedicated to creating compelling content for various platforms.


