
- EUR/USD reverses two sessions in a row with losses around 0.9900.
- The resumption of the descent should not be ruled out yet.
The EUR/USD bounces back to the 0.9915 area, where initial resistance has so far appeared on Wednesday.
The pair’s inability to extend the rebound should leave it vulnerable to further weakness in the near term, with the next major support emerging at the weekly low of 0.9704 (Oct 21).
In the longer term, the bearish view on the pair should remain unchanged as long as it is below the 200-day SMA at 1.0481.
EUR/USD daily chart
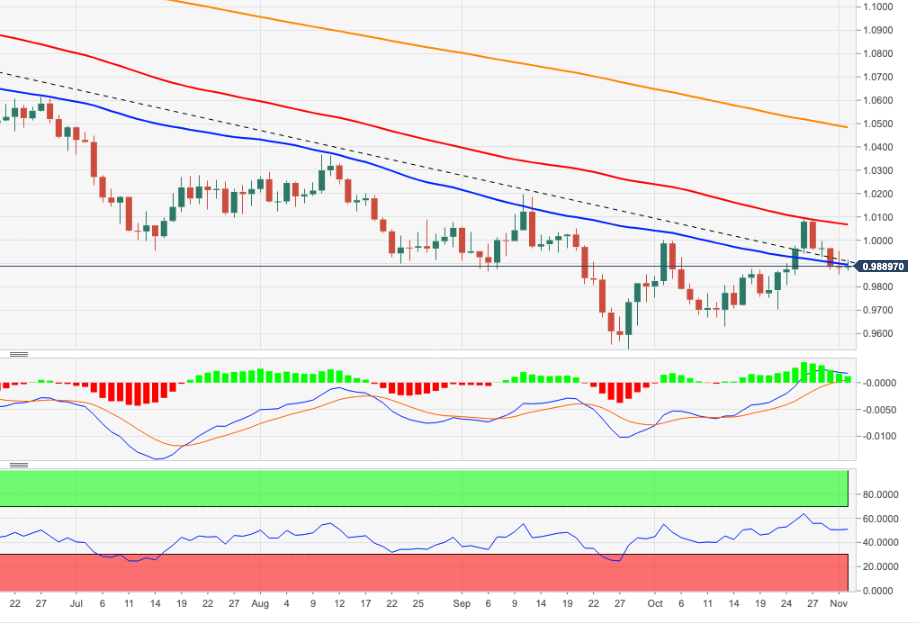
Source: Fx Street
With 6 years of experience, I bring to the table captivating and informative writing in the world news category. My expertise covers a range of industries, including tourism, technology, forex and stocks. From brief social media posts to in-depth articles, I am dedicated to creating compelling content for various platforms.


