
- EUR/USD rebounds sharply from recent oversold levels.
- Further gains are seen revisiting the 1.0200 area.
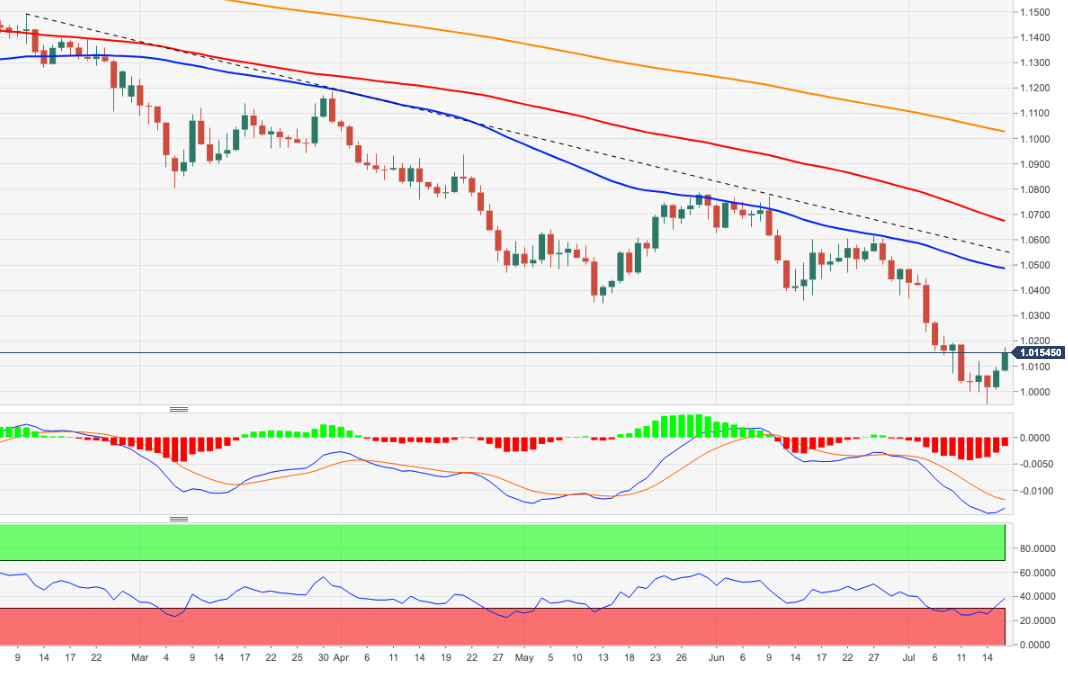
The EUR/USD moves higher and adds to Friday’s bounce, retesting the 1.0170/75 area earlier in the week.
Further gains could lead to a retest of the 1.0200 zone sooner rather than later, although the pair’s bearish stance remains. Conversely, a resumption of the downtrend should find initial containment at the key parity level ahead of the 2022 low at 0.9952 (14 Jul).
As long as the pair navigates below the 5-month support line around 1.0540, further losses are anticipated.
In the long term, the bearish view of the pair is expected to prevail as long as it trades below the 200-day SMA at 1.1026.
EUR/USD daily chart
Technical levels
Source: Fx Street
With 6 years of experience, I bring to the table captivating and informative writing in the world news category. My expertise covers a range of industries, including tourism, technology, forex and stocks. From brief social media posts to in-depth articles, I am dedicated to creating compelling content for various platforms.


