
- EUR/USD accelerates losses and falls to new cycle lows.
- Below the low for the year is the December 2002 low at 0.9859.
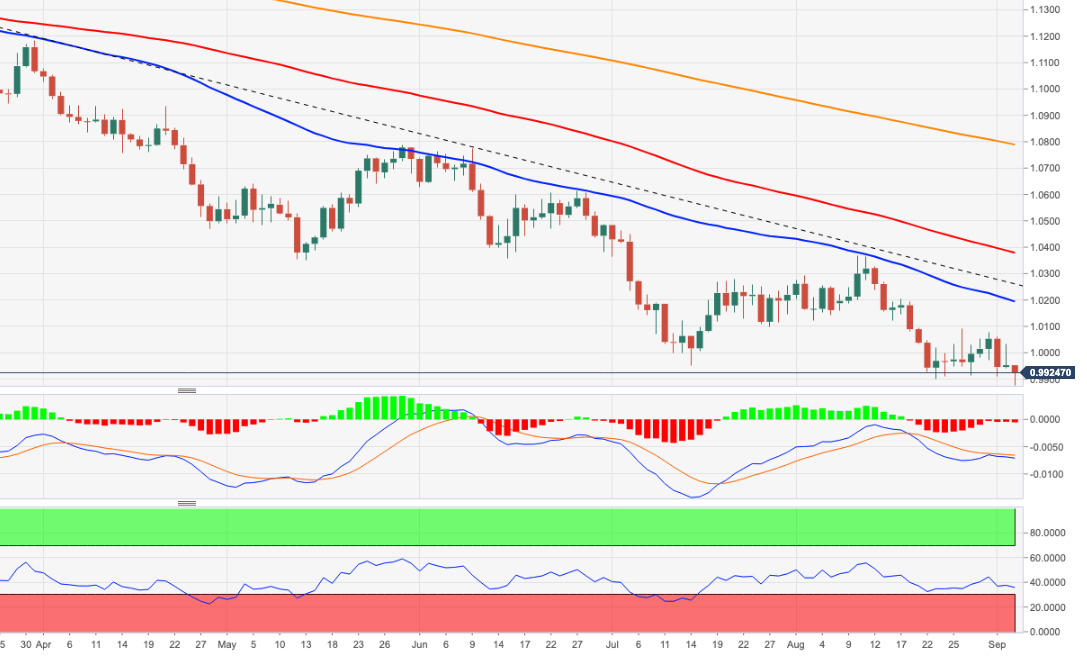
The EUR/USD resumes the leg down and breaks below the 0.9900 level to hit a fresh two-decade low in the 0.9880/75 area on Monday.
A continuation of the downtrend cannot be ruled out yet as the daily RSI around 36 still allows for some weakness before reaching oversold territory.
Conversely, the next support to watch is found at 0.9859 (Dec 2002 low), followed by 0.9685 (Oct 2002 low).
In the long term, the bearish view on the pair is expected to prevail as long as it trades below the 200-day SMA at 1.0787.
EUR/USD daily chart
Technical levels
Source: Fx Street
With 6 years of experience, I bring to the table captivating and informative writing in the world news category. My expertise covers a range of industries, including tourism, technology, forex and stocks. From brief social media posts to in-depth articles, I am dedicated to creating compelling content for various platforms.


.jpg "Inside the “feud” between the Beckhams and Harry and Meghan Markle (big absentees at Victoria's party)")

