
- EUR/USD crashes below 1.0300.
- A probable drop to parity is on the horizon.
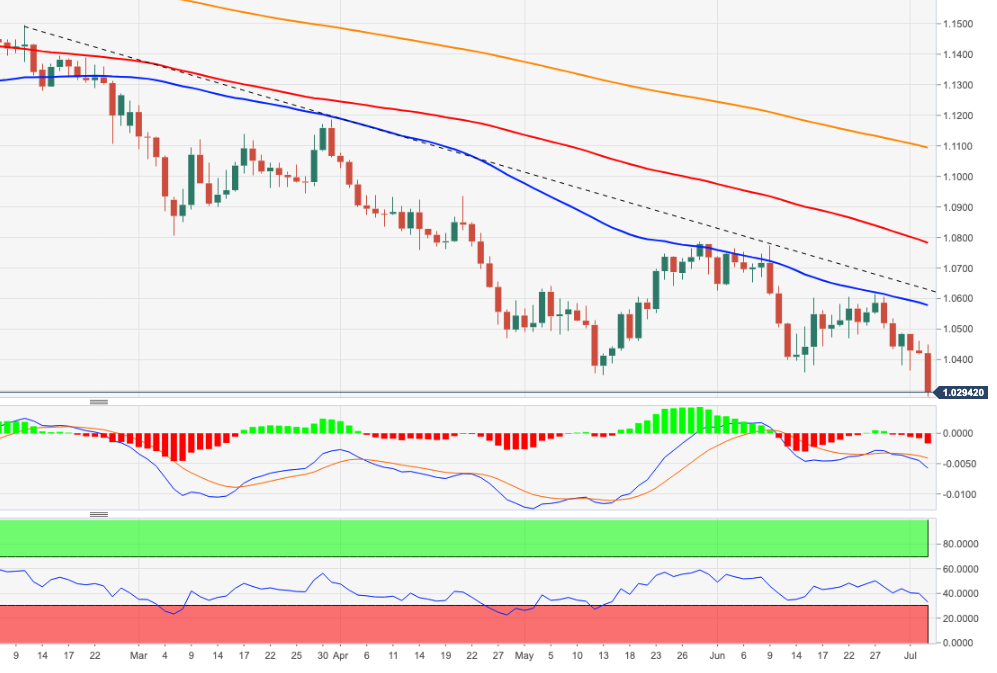
The EUR/USD slumps to levels last seen in December 2002, around 1.0280, at Tuesday’s trend reversal.
Recession fears seem to dominate investor sentiment and keep sentiment around the European currency well depressed. Against this gloomy backdrop, further short-term losses are not to be ruled out, with the next target at parity. From here, the December 2002 low at 0.9859 (December 2).
In the long term, the bearish view on the pair is expected to prevail as long as it trades below the 200-day SMA at 1.1092.
EUR/USD daily chart
Technical levels
Source: Fx Street
With 6 years of experience, I bring to the table captivating and informative writing in the world news category. My expertise covers a range of industries, including tourism, technology, forex and stocks. From brief social media posts to in-depth articles, I am dedicated to creating compelling content for various platforms.


