
- EUR/USD continues its bullish momentum, supported by a bullish bias observed on the daily chart analysis.
- The pair could find resistance near a four-month high at 1.0922.
- The lower boundary of the ascending channel around the level of 1.0870 could serve as immediate support.
EUR/USD is advancing for the second consecutive day, trading around 1.0900 during the Asian session on Wednesday. The daily chart analysis shows an uptrend as the pair remains within an ascending channel.
Moreover, the 14-day Relative Strength Index (RSI), a momentum indicator, is above the 50 level, which further reaffirms the bullish sentiment for the EUR/USD pair. The continued bullish momentum could strengthen the pair’s bullish bias.
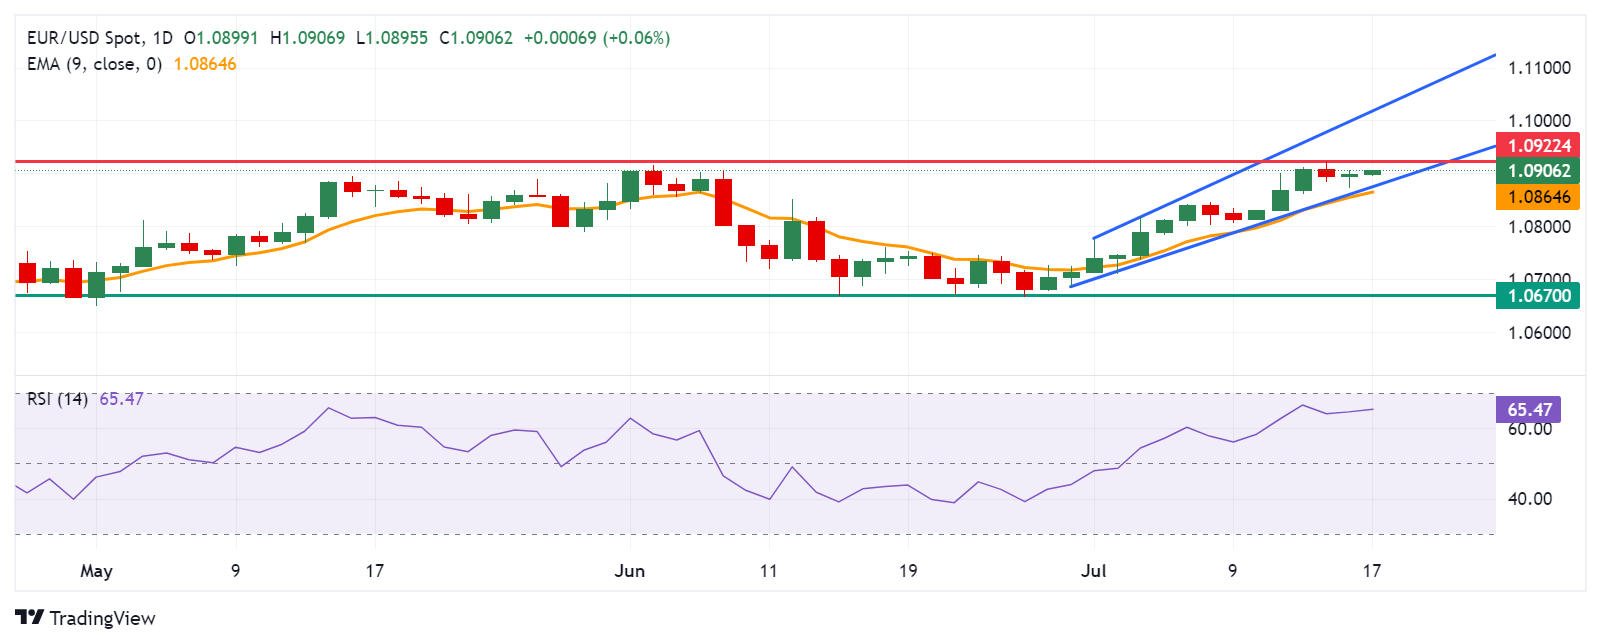
The EUR/USD pair is approaching potential resistance near a four-month high of 1.0922, seen on July 15. Further resistance is anticipated around the psychological level of 1.1000, followed by the upper boundary of the ascending channel near 1.1020.
On the downside, initial support for the EUR/USD pair is expected near the lower boundary of the ascending channel around the level of 1.0870, which coincides with the nine-day exponential moving average (EMA) at 1.0864.
A break below this level could intensify the downward pressure on the pair, targeting support around the key level of 1.0670, which could serve as a retracement support level.
EUR/USD: Daily Chart
Euro PRICE Today
The table below shows the exchange rate of the Euro (EUR) against major currencies today. The Euro was the strongest currency against the Swiss Franc.
| USD | EUR | GBP | JPY | CAD | AUD | NZD | CHF | |
|---|---|---|---|---|---|---|---|---|
| USD | -0.06% | -0.02% | 0.00% | -0.01% | -0.07% | -0.31% | 0.00% | |
| EUR | 0.06% | 0.06% | 0.07% | 0.06% | 0.02% | -0.27% | 0.08% | |
| GBP | 0.02% | -0.06% | 0.00% | 0.00% | -0.06% | -0.33% | 0.03% | |
| JPY | 0.00% | -0.07% | 0.00% | -0.02% | -0.07% | -0.34% | 0.02% | |
| CAD | 0.01% | -0.06% | 0.00% | 0.02% | -0.07% | -0.31% | 0.03% | |
| AUD | 0.07% | -0.02% | 0.06% | 0.07% | 0.07% | -0.25% | 0.09% | |
| NZD | 0.31% | 0.27% | 0.33% | 0.34% | 0.31% | 0.25% | 0.34% | |
| CHF | -0.00% | -0.08% | -0.03% | -0.02% | -0.03% | -0.09% | -0.34% |
The heatmap shows percentage changes of major currencies. The base currency is selected from the left column, while the quote currency is selected from the top row. For example, if you choose the Euro from the left column and move along the horizontal line to the US Dollar, the percentage change shown in the chart will represent EUR (base)/USD (quote).
Source: Fx Street
I am Joshua Winder, a senior-level journalist and editor at World Stock Market. I specialize in covering news related to the stock market and economic trends. With more than 8 years of experience in this field, I have become an expert in financial reporting.


