
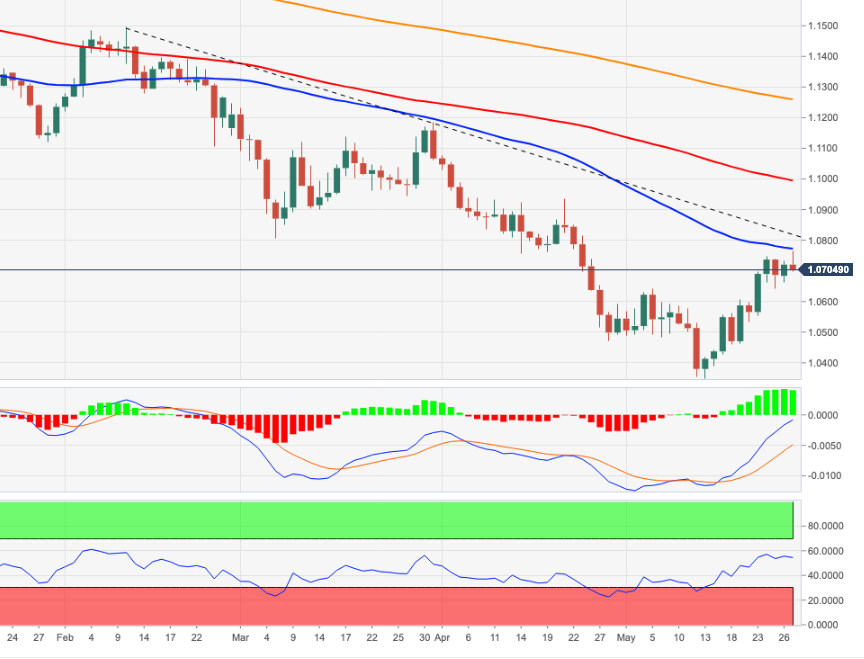
- EUR/USD advances to fresh monthly highs near 1.0770.
- Further gains now point to the resistance line near 1.0820.
EUR/USD is under pressure shortly after hitting new highs near 1.0770 on Friday.
Considering the current price action of the pair, a continuation of the bounce seems likely, at least in the short term. That said, the next barrier now appears at the 55-day SMA today at 1.0770, ahead of the 3-month resistance line near 1.0820.
A breakout of this area should ease selling pressure and allow a likely move to the 21st Apr 1.0936 high.
EUR/USD day chart
Source: Fx Street
With 6 years of experience, I bring to the table captivating and informative writing in the world news category. My expertise covers a range of industries, including tourism, technology, forex and stocks. From brief social media posts to in-depth articles, I am dedicated to creating compelling content for various platforms.


