
- EUR/USD regains some poise and bounces off 0.9800.
- Losing this zone exposes a drop towards the 0.9685 level.
The EUR/USD trades at new cycle lows around 0.9800 and causes a sharp bounce soon after.
The pair seems to have found some apparent containment at the 0.9800 zone so far. However, for the time being, further weakness is expected and could force the pair to challenge this zone sooner rather than later. Breakout of this zone could lead to a visit to the October 2022 low at 0.9685.
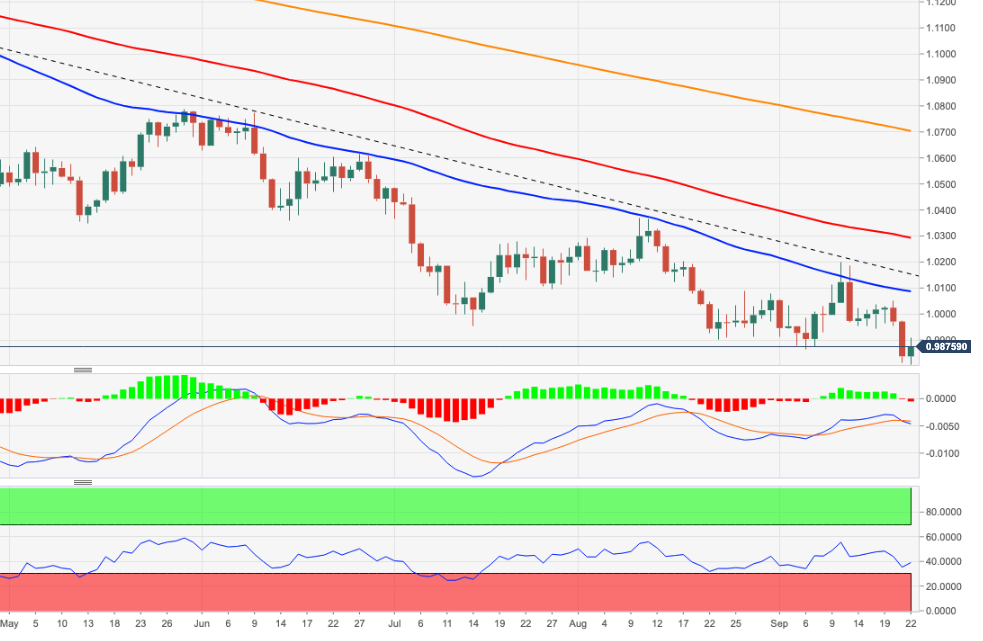
In the long term, the bearish view of the pair is expected to prevail as long as it trades below the 200-day SMA at 1.0701.
EUR/USD daily chart
Technical levels
Source: Fx Street
With 6 years of experience, I bring to the table captivating and informative writing in the world news category. My expertise covers a range of industries, including tourism, technology, forex and stocks. From brief social media posts to in-depth articles, I am dedicated to creating compelling content for various platforms.


