
- EUR/USD attracts some buyers towards 1.0835 amid USD weakness on Wednesday.
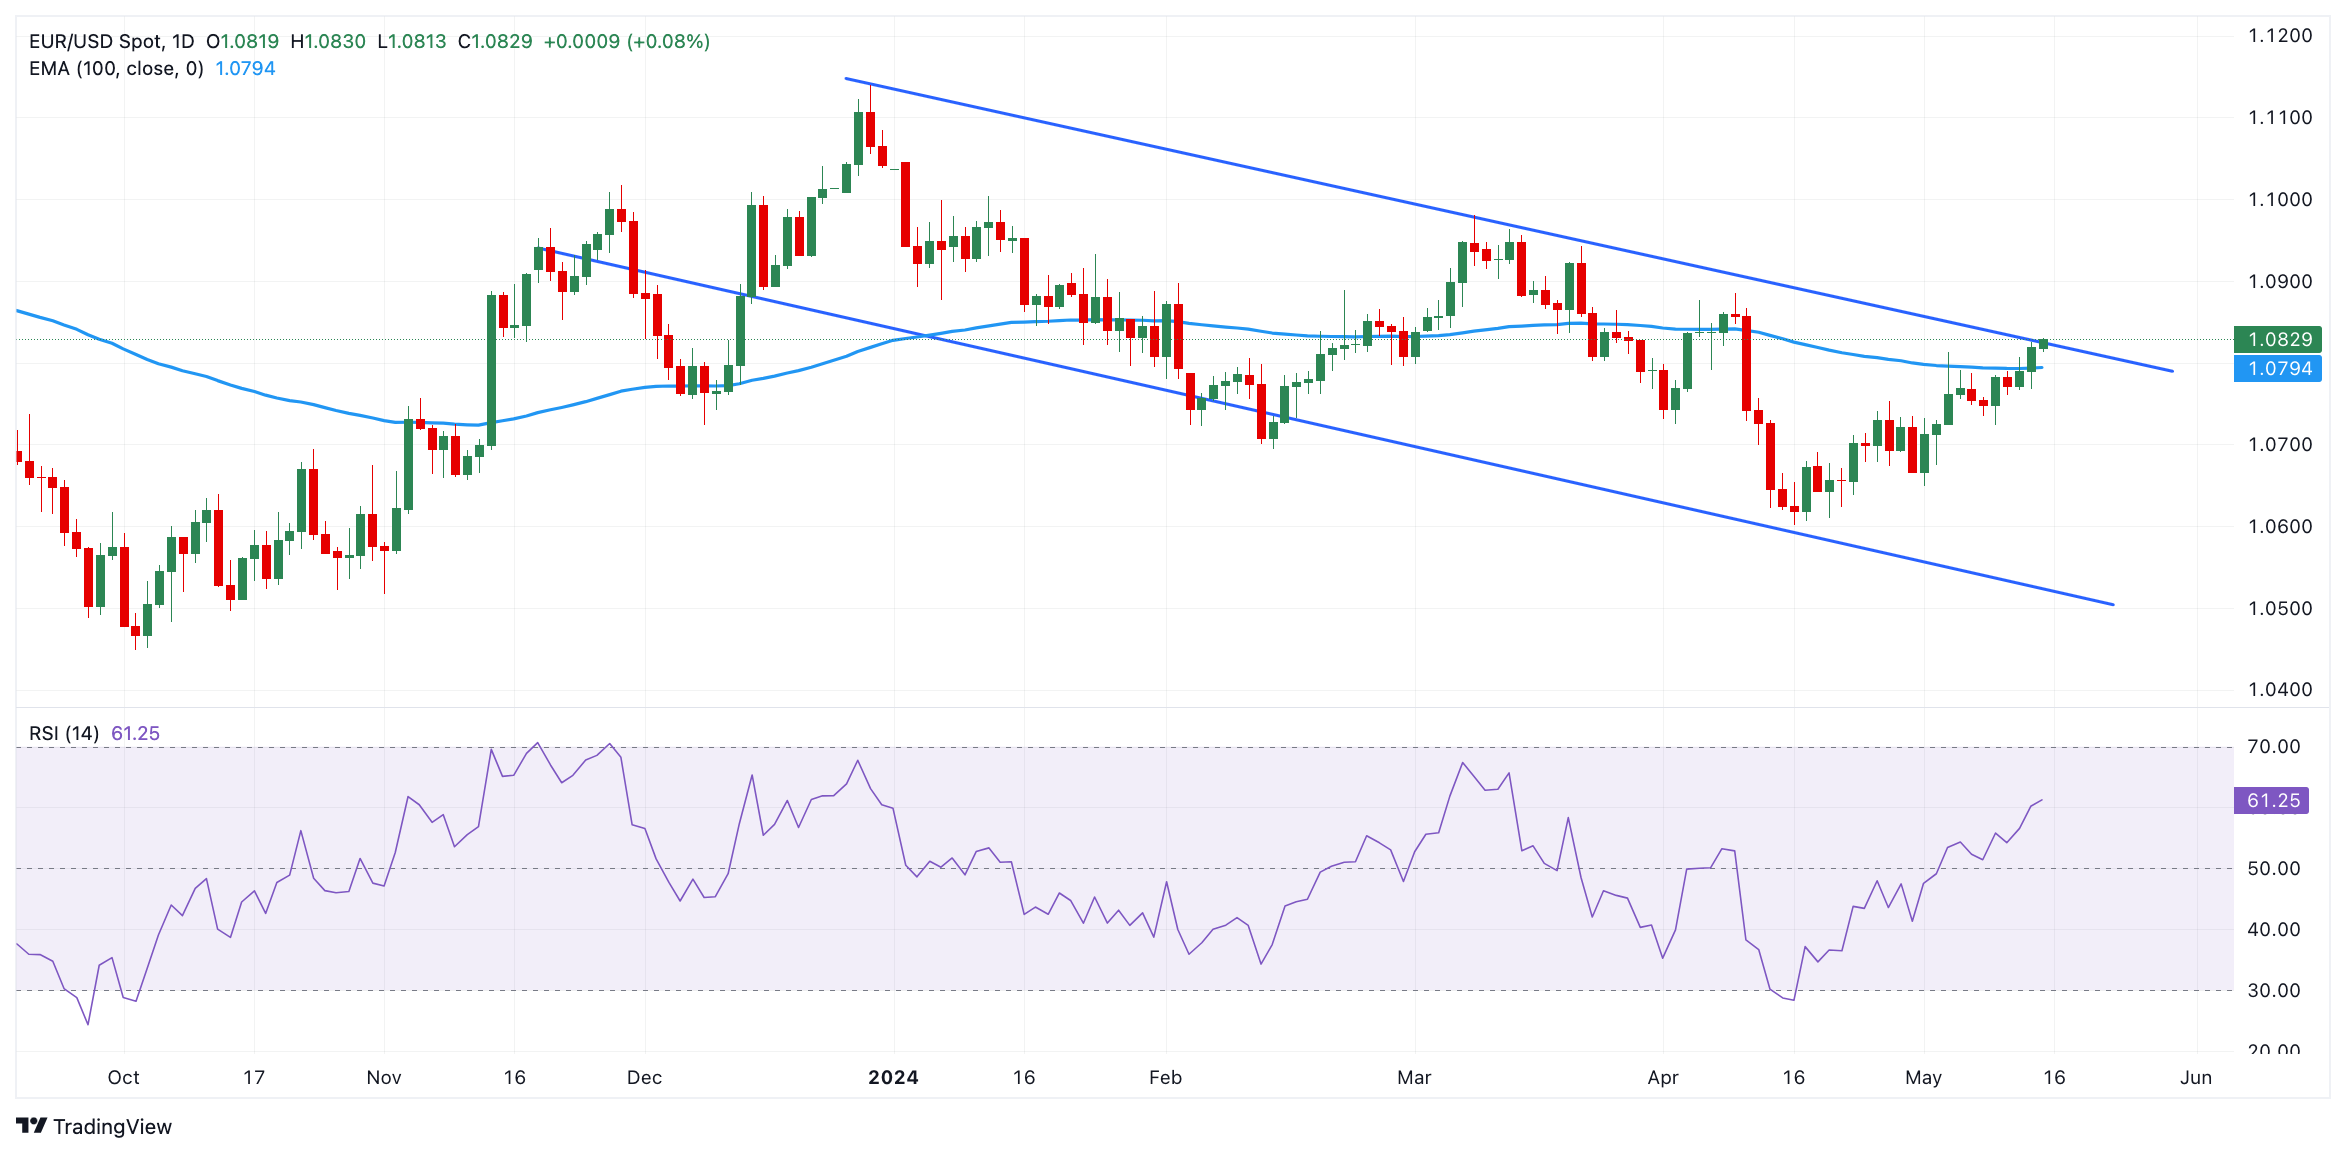
- The pair resumes its uptrend as it remains above the key EMA; The RSI indicator is in bullish territory.
- The next bullish barrier is seen at 1.0885; The first bearish objective is located at 1.0795.
EUR/USD extended its recovery towards 1.0835 during the early hours of the European session. The pair's rally was boosted by optimism from the ZEW Economic Sentiment Survey and the weakening of the US Dollar (USD). Investors have been closely monitoring the Eurozone GDP growth figure, which grew by 0.3% quarter-on-quarter in the first quarter of 2024.
Based on the daily chart, EUR/USD has remained confined in a downtrend channel since mid-December 2023. The pair's bullish outlook resumes as it crosses above the key 100-day EMA. Furthermore, the bullish momentum is reinforced by the 14-day Relative Strength Index (RSI), which is in bullish territory around 60.80, indicating that the bullish outlook is favorable.
The main pair breaks above the upper boundary of the downtrend channel and the psychological level of 1.0800. The next resistance level lies at the April 9 high at 1.0885. The other bullish filter to watch is the March 21 high at 1.0943, on the way to the March 8 high at 1.0981 and finally the psychological level of 1.1000.
On the other hand, the first bearish target for EUR/USD will emerge near the 100-day EMA at 1.0795. Any selling below this level will cause a drop to the May 9 low at 1.0724. Further south, the next level of containment lies around a May 2 low at 1.0650, followed by an April 16 low at 1.0600.
EUR/USD Daily Chart
Source: Fx Street
I am Joshua Winder, a senior-level journalist and editor at World Stock Market. I specialize in covering news related to the stock market and economic trends. With more than 8 years of experience in this field, I have become an expert in financial reporting.


 of the afternoon five news")

