
- EUR/USD is under pressure after faltering before 1.0300.
- More rallies and a breakout of 1.0300 are expected.
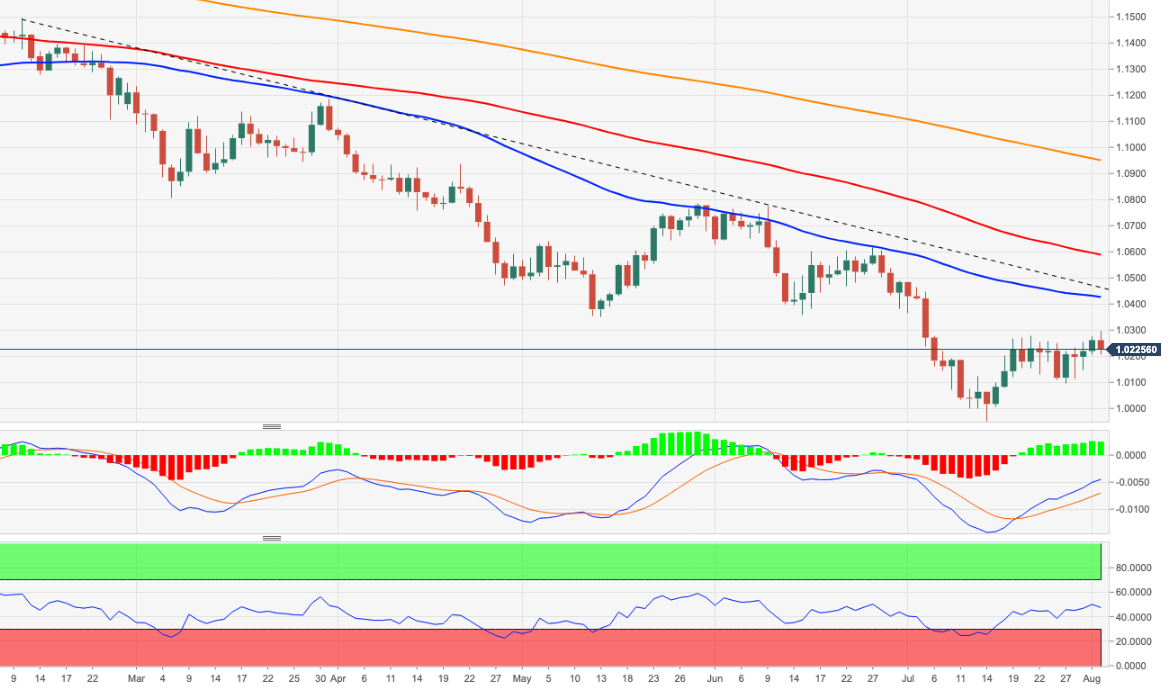
The EUR/USD advanced to levels near 1.0300 and triggered a downward correction shortly after.
Ideally, the pair should clear the area of recent highs to allow the bounce to continue in the short term. That said, above the 1.0300 area the pair should find the next upside barrier at the 55-day SMA today at 1.0423.
Beyond the latter comes the 6-month support line around 1.0440, above which the downside pressure is expected to ease.
In the longer term, the bearish view on the pair is expected to prevail as long as it trades below the 200-day SMA at 1.0949.
EUR/USD daily chart
Technical levels
Source: Fx Street
With 6 years of experience, I bring to the table captivating and informative writing in the world news category. My expertise covers a range of industries, including tourism, technology, forex and stocks. From brief social media posts to in-depth articles, I am dedicated to creating compelling content for various platforms.


