
- EUR/USD advances above the 1.0200 barrier on Tuesday.
- Continuation of the uptrend could see 1.0300 retested in the short term.
The EUR/USD flirt with the multi-day high zone around 1.0250 posting gains for the second consecutive session on Tuesday.
The August high at 1.0293 (Aug 2) looks like the bull magnet at the moment. Above this level, spot is expected to see its uptrend reinforced and could challenge the short-term 55-day temp SMA today at 1.0386.
In the long term, the bearish view of the pair is expected to prevail as long as it trades below the 200-day SMA at 1.0913.
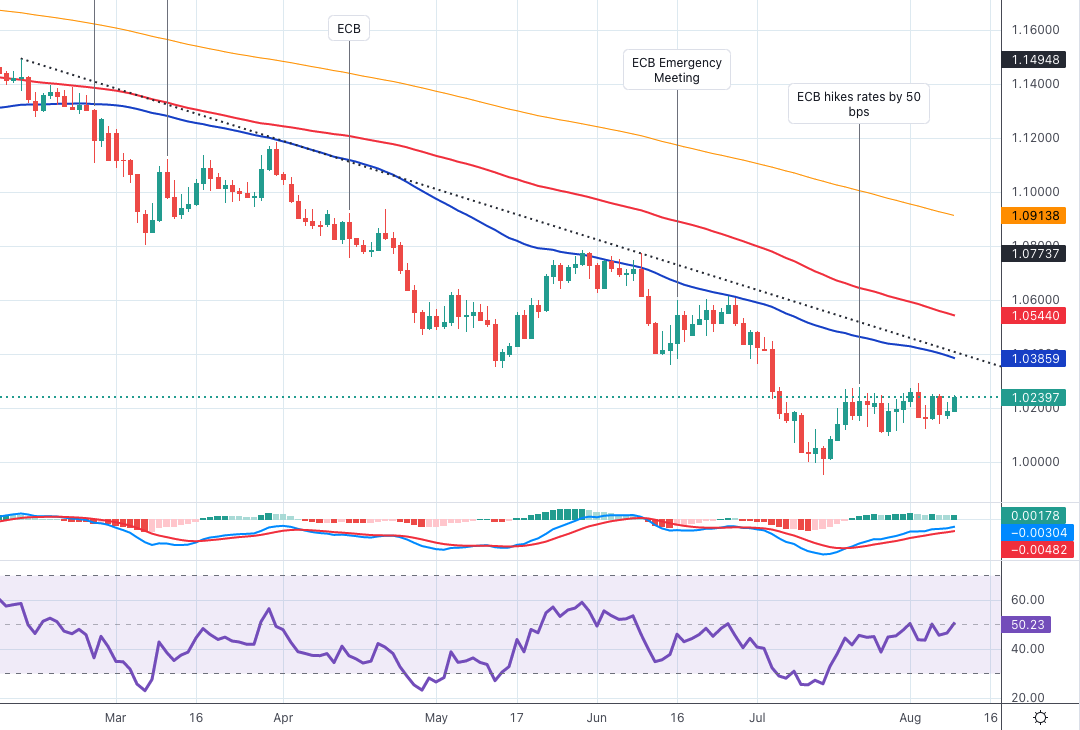
EUR/USD daily chart
Technical levels
Source: Fx Street
With 6 years of experience, I bring to the table captivating and informative writing in the world news category. My expertise covers a range of industries, including tourism, technology, forex and stocks. From brief social media posts to in-depth articles, I am dedicated to creating compelling content for various platforms.


