
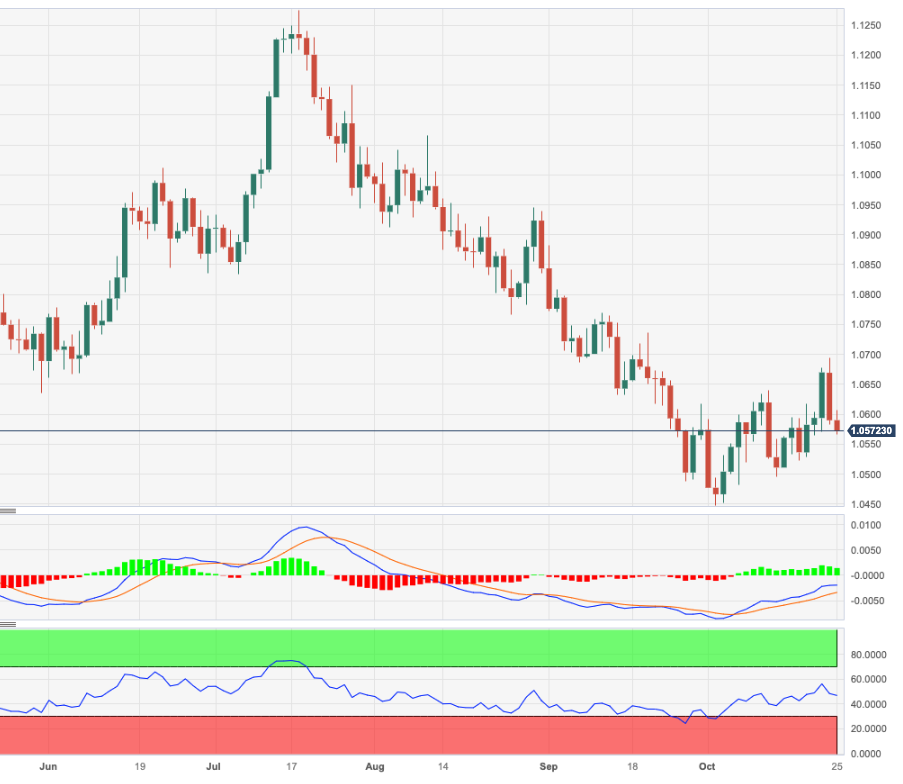
- EUR/USD adds to Tuesday’s decline and retreats to 1.0570.
- Immediate support is around the 1.0500 area.
He EUR/USD remains under pressure and sinks towards weekly lows in the 1.0570/65 band on Wednesday.
If losses accelerate, the pair could fall to the weekly low of 1.0495 (Oct 13) before the 2023 low of 1.0448 (Oct 3). The loss of the latter could once again put a probable visit to the round level of 1.0400 on the radar in the not too distant future.
Meanwhile, below the 200-day SMA at 1.0815, the outlook for the pair should remain negative.
EUR/USD Daily Chart
Source: Fx Street
I am Joshua Winder, a senior-level journalist and editor at World Stock Market. I specialize in covering news related to the stock market and economic trends. With more than 8 years of experience in this field, I have become an expert in financial reporting.


