- EUR/USD breathes a sigh of relief ahead of Thursday’s ECB.
- The ECB is ready to raise rates by 75 basis points, the key is in Lagarde’s press conference.
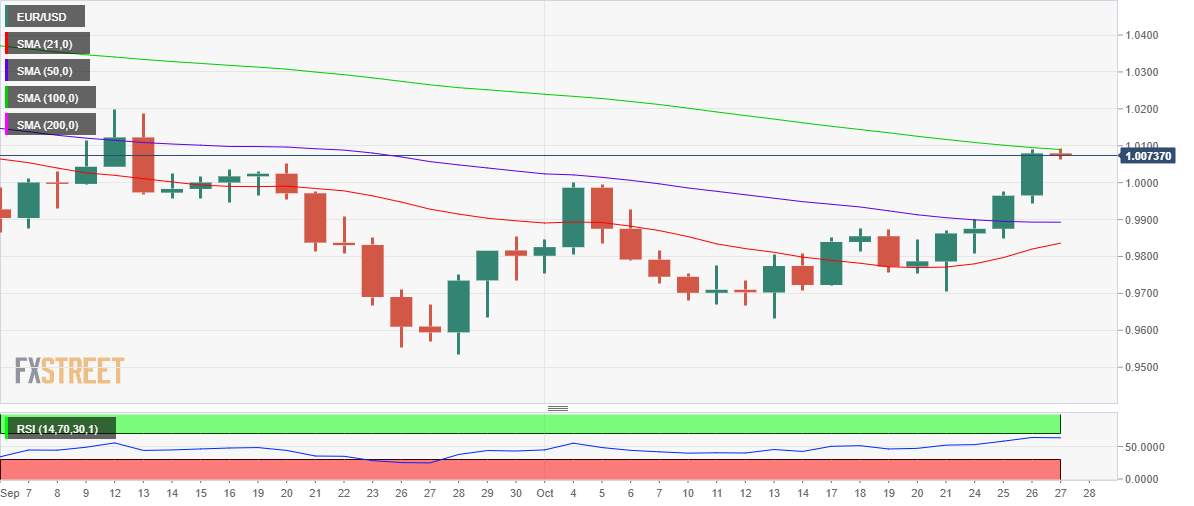
- Euro bulls run into 100-day SMA at 1.0090, what can we expect?
The EUR/USD It is trading virtually unchanged on the day around 1.0075 at the start of the European session. Investors pause and refrain from opening directional positions in the pair, pending the critical decision of the ECB rate hike and the publication of the third quarter GDP in the US.
The expectations of an aggressive interest rate hike by the ECB have underpinned the recent rally in EUR/USD, while the dollar was sold on rumors about a possible change of the Fed towards a dovish stancegiven the weak economic data from the world’s largest economy.
Looking ahead, “the Attention will be focused on the monetary policy statement that will accompany the press conference after the meeting, amid concerns about economic headwinds stemming from the protracted war between Russia and Ukraine“Earlier this month, ECB President Christine Lagarde referred to raising rates “as the best tool to fight runaway inflation,” explains FXStreet editor Haresh Menghani.
US growth figures will also be watched for further clues on the Fed’s tightening outlook.
EUR/USD Technical Outlook
The 100-day SMA sloping down at 1.0090 is the critical resistance ahead of the ECB’s verdict.
An aggressive interest rate hike by the ECB could allow the bulls to break above the latter, triggering a new uptrend towards 1.0200.
The 14-day RSI has turned down but remains well above the 50 level, which keeps the bulls hopeful.
EUR/USD daily chart
If the ECB surprises on the downside, it could start a fresh pullback in the pair, with the bears eyeing the 100 SMA.
Wednesday’s low in 0.9943 could limit the fall towards the barrier of 0.9900.
EUR/USD additional levels
| Overview | |
|---|---|
| last price today | 1.0078 |
| daily change today | -0.0004 |
| Today’s daily variation in % | -0.04 |
| Daily opening today | 1.0079 |
| Trends | |
|---|---|
| daily SMA20 | 0.9824 |
| daily SMA50 | 0.9893 |
| daily SMA100 | 1.0095 |
| daily SMA200 | 1.0518 |
| levels | |
|---|---|
| Previous daily high | 1.0089 |
| Previous Daily Low | 0.9944 |
| Previous Weekly High | 0.9876 |
| Previous Weekly Low | 0.9705 |
| Previous Monthly High | 1.0198 |
| Previous Monthly Low | 0.9536 |
| Daily Fibonacci of 38.2% | 1.0033 |
| Daily Fibonacci of 61.8% | 0.9999 |
| Daily Pivot Point S1 | 0.9986 |
| Daily Pivot Point S2 | 0.9892 |
| Daily Pivot Point S3 | 0.984 |
| Daily Pivot Point R1 | 1.0131 |
| Daily Pivot Point R2 | 1.0183 |
| Daily Pivot Point R3 | 1.0276 |
Source: Fx Street
With 6 years of experience, I bring to the table captivating and informative writing in the world news category. My expertise covers a range of industries, including tourism, technology, forex and stocks. From brief social media posts to in-depth articles, I am dedicated to creating compelling content for various platforms.


