
- EUR/USD extends recovery to 3-week highs above 1.0100.
- More gains are expected once the 7-month resistance line is broken.
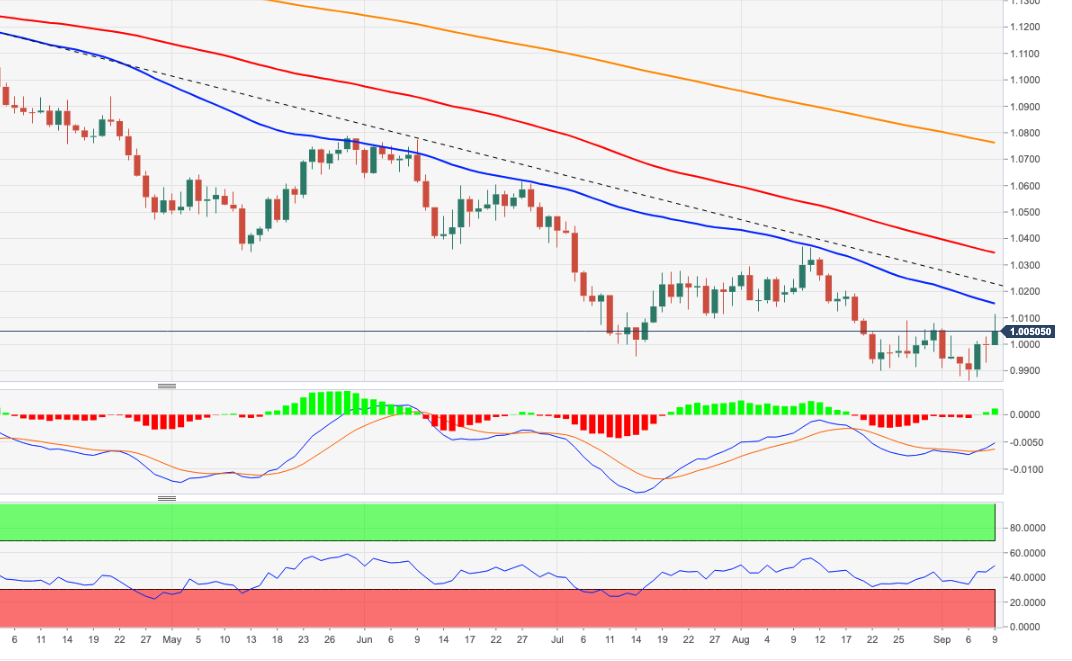
The EUR/USD regains bullish traction and rises above 1.0100, or multi-week highs, on Friday.
Further upside should meet the temporary hurdle of the 55-day SMA at 1.0152 before the 7-month resistance line, today near 1.0200, an area that also coincides with a minor upside barrier at 1.0202 (Aug 17). ). The pair should see its downward pressure mitigated once this zone is overcome.
In the long term, the bearish view of the pair is expected to prevail as long as it trades below the 200-day SMA at 1.0760.
EUR/USD daily chart
Technical levels
Source: Fx Street
With 6 years of experience, I bring to the table captivating and informative writing in the world news category. My expertise covers a range of industries, including tourism, technology, forex and stocks. From brief social media posts to in-depth articles, I am dedicated to creating compelling content for various platforms.


