
- EUR/USD is under pressure and falls to 1.0650.
- There is still room for an extra rise in the short term.
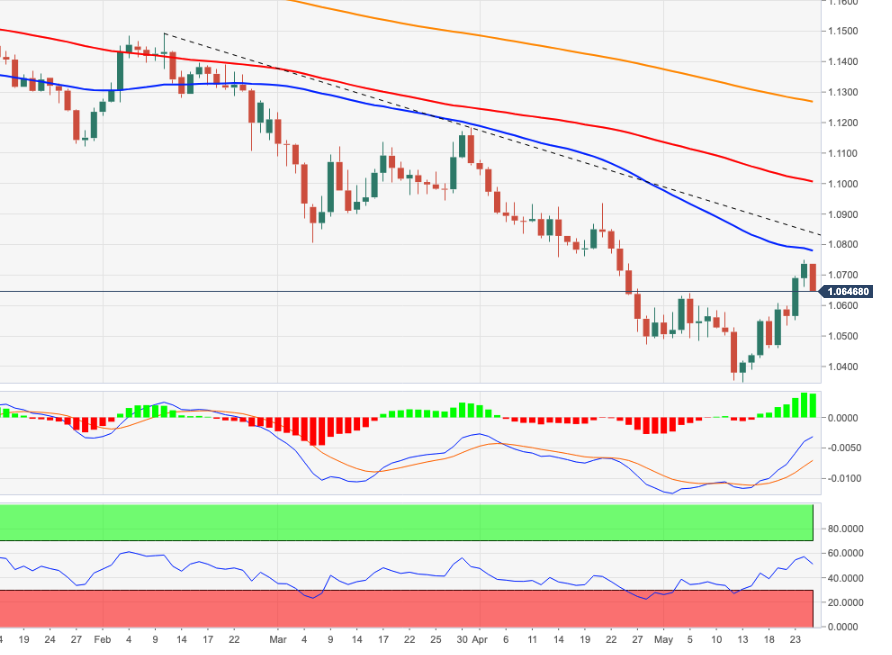
The EUR/USD trims part of its recent advance to the 1.0750 region and returns to the 1.0650 area on Wednesday.
Considering the pair’s current price action, a continuation of the bounce looks likely in the very short term. That said, the next upside barrier now appears at the 55-day SMA today at 1.0787, prior to the 3-month resistance line around 1.0830.
A breakout of this area should relieve selling pressure and allow a likely move to the weekly high at 1.0936 (21st Apr).
The daily RSI around 51 also indicates that further upside could still be in the offing for the pair until it reaches overbought territory (>70).
EUR/USD daily chart
Technical Levels
Source: Fx Street
With 6 years of experience, I bring to the table captivating and informative writing in the world news category. My expertise covers a range of industries, including tourism, technology, forex and stocks. From brief social media posts to in-depth articles, I am dedicated to creating compelling content for various platforms.


